Hi there, fellow traders and investors! If you’re passionate about the world of stocks and financial markets, you’re in the right place. In this article, we’re going to delve into a detailed chart analysis of Roku, Inc (Ticker: ROKU) using technical chart patterns and indicators. Whether you’re an experienced trader or just starting your investment journey, we’ve got valuable insights to share. So, let’s jump right into it!
🔔 Today’s Stock Pick
Roku, Inc (Ticker: ROKU)
As savvy investors, it’s essential to stay informed about potential opportunities in the market. Today’s spotlight is on Roku, Inc, a company that has caught our attention due to its intriguing technical chart patterns. Roku has shown some interesting price movements recently, and we’re here to dissect them.
📈 Dive into the Technical Point

👉 Looking For The Best Online Trading Chart Platform? Check What I’m Using (Pro+)
● Bottom Formation and Cup Pattern
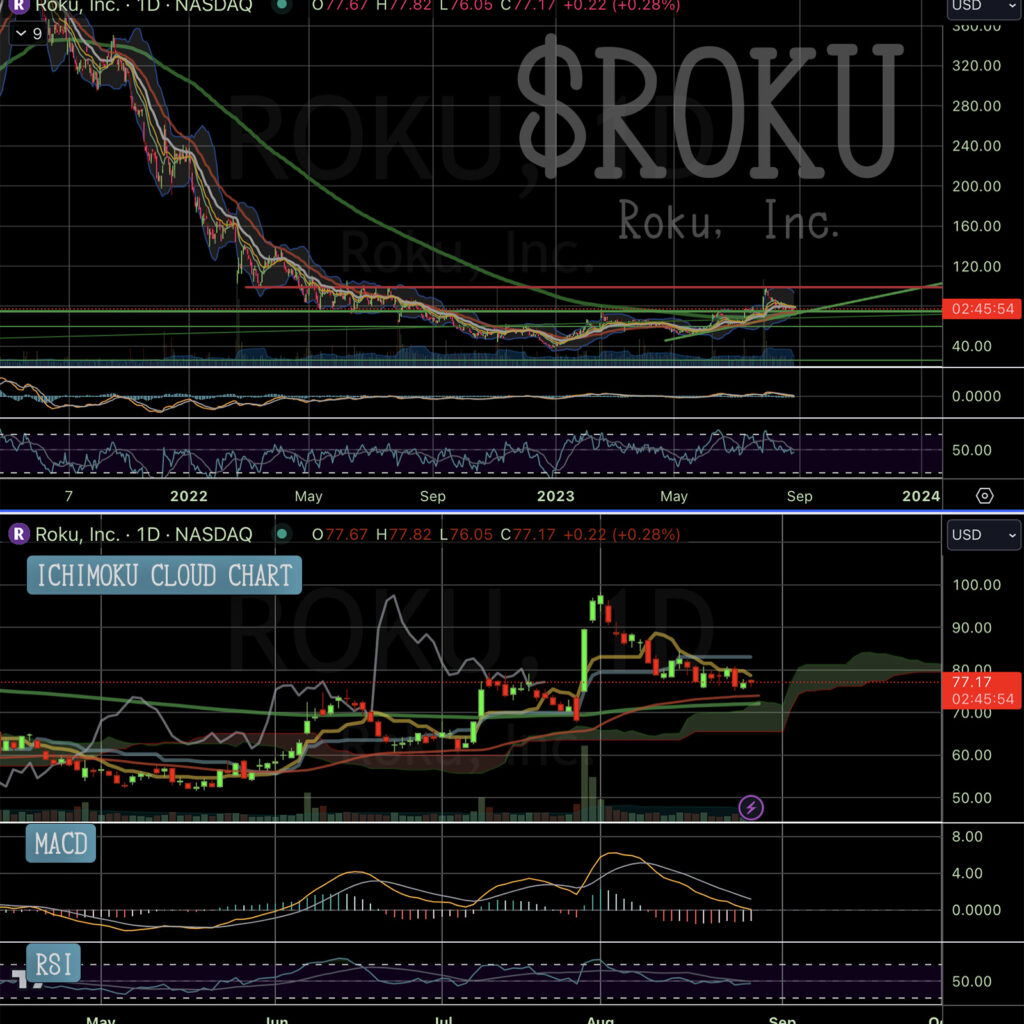
Roku has been undergoing a fascinating transformation over the past year. Towards the end of the previous year, we witnessed a bottoming process in the stock’s price chart. This hinted at the possibility of a reversal of the downward trend that had been prevalent. Currently, the chart is indicating the formation of a significant cup pattern. This pattern is characterized by a gradual rounding of price movements followed by the potential for an uptrend. Known as a bullish continuation pattern, the cup formation suggests the potential for renewed upward momentum.
● Crucial Support and Golden Cross
A crucial technical aspect that has caught our attention is the role of the 50-day Exponential Moving Average (50dEMA) as a critical support level for Roku. Presently, the stock is actively testing this support line. Additionally, the emergence of a golden cross has added to the overall bullish sentiment. The golden cross occurs when the 50dEMA intersects with the 200-day Exponential Moving Average (200dEMA). This cross signals a potential shift in trend as the shorter-term moving average overtakes the longer-term moving average, potentially propelling the stock upwards.
● Ichimoku Cloud Caution
While the golden cross is promising, a word of caution is necessary due to the Ichimoku Cloud analysis. The convergence of the conversion line and baseline into a “dead cross” formation is something to keep an eye on. This bearish Ichimoku signal implies the potential for a reversal of momentum. The question remains whether Roku can stage a rebound from the robust support zone despite this cautionary sign, which could significantly influence its near-term price action.
● Multi-Factor Support Zone
Intriguingly, a confluence of technical indicators is coming together to form a robust support area for Roku. This includes the 50dEMA, 200dEMA, trend line, and Ichimoku Cloud’s support zone (KUMO). The presence of this multi-factor support zone significantly enhances the likelihood of a potential price bounce from this level. The combination of these indicators underscores the importance of this support area in shaping the stock’s immediate trajectory.
💡 Chart Technical Tips
*Cup Pattern (CUP)*
The “Cup” pattern is a bullish technical formation that features a rounded bottom, followed by the potential for an uptrend. This pattern typically indicates a period of consolidation and accumulation before a potential breakout. In the context of Roku’s chart, the formation of a “huge cup” pattern suggests that the stock has undergone a bottoming process and could be gearing up for a sustained upward movement. Completion of the cup pattern often leads to increased buying interest and the potential for an extended bullish trend.
🏹 For The Success Of Your Trading
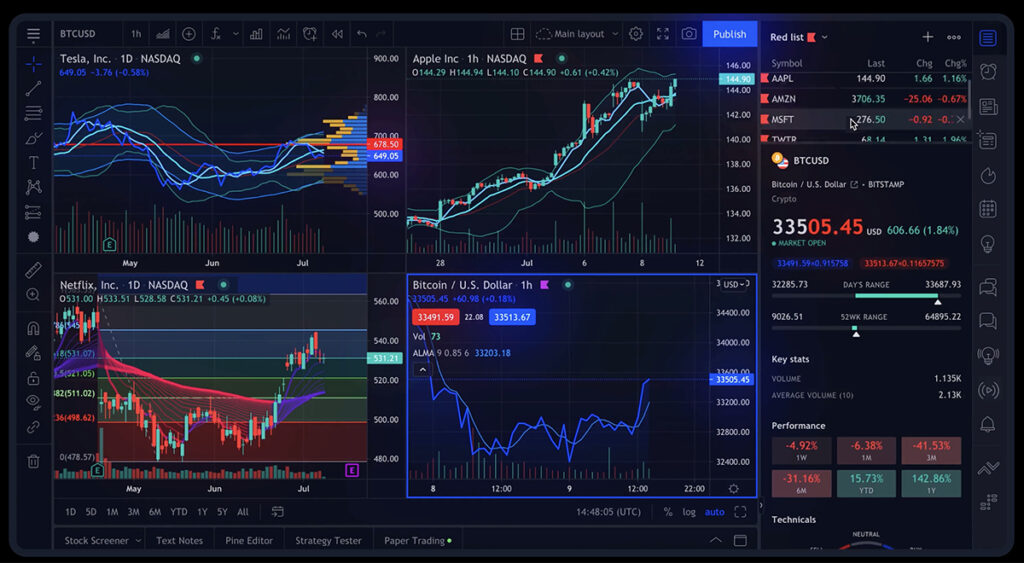
As we embark on this stock analysis journey, having access to reliable and comprehensive tools is crucial for making informed trading decisions. I am using TradingView, a platform that stands out in the realm of stock chart analysis.

This robust online trading platform offers a wide array of features and tools that empower traders and investors to conduct thorough chart analysis. To read my comprehensive review of TradingView, 👇🏽👇🏿check out this article:
“How TradingView Can Change the Game for Traders“
To explore the advantages of TradingView, feel free to access the platform here.
🍵 Conclusion
In conclusion, Roku, Inc (Ticker: ROKU) presents a compelling case for traders and investors. The technical analysis points towards interesting developments in the stock’s price chart. The cup pattern, coupled with crucial support levels and the golden cross, paints an optimistic picture for potential upward movement. However, the cautionary signal from the Ichimoku Cloud reminds us to remain vigilant. The multi-factor support zone adds an extra layer of significance to the current price level.
As always, remember that thorough research and risk management are essential when making trading decisions. Stay tuned for more updates and insights as we continue our journey through the world of stock chart analysis.
🌿 FAQs
1. What is the significance of the cup pattern?
The cup pattern indicates a potential bottoming process followed by a bullish uptrend. It’s a pattern of consolidation and accumulation that often precedes a breakout.
2. What is the golden cross, and why is it important?
The Golden Cross is a significant market event. It occurs when a short-term moving average crosses above a long-term moving average. This crossover signals a potential shift in trend towards upward momentum. It’s a signal that traders and analysts closely monitor to gauge possible buying opportunities and shifts in market sentiment.
3. Should I be concerned about the Ichimoku Cloud’s cautionary signal?
While the Ichimoku Cloud’s cautionary signal is worth noting, it’s just one aspect of the analysis. Consider it alongside other indicators for a comprehensive view.
4. What does a multi-factor support zone mean for a stock’s trajectory?
A multi-factor support zone combines various technical indicators to create a strong support area. It enhances the likelihood of a price bounce from that level.
5. Where can I access real-time ROKU stock charts?
For real-time ROKU stock charts, check TradingView, which is what I’m using. It’s the best online trading platform, offering a comprehensive toolkit to traders!
👉 👉 Connect with Me: Instagram and StockTwits ✌️


