Are you ready to elevate your stock trading strategy to new heights? Today, we’re diving into the world of stock market analysis, examining the chart of Aehr Test Systems (Ticker: AEHR) .
In this article, we’ll explore the technical aspects of AEHR and reveal the secrets of a successful stock trading strategy. So, buckle up and get ready to chart your course to trading success!
✏️Table of Contents
🔔 Today’s Stock Pick
Aehr Test Systems (Ticker: AEHR)
Aehr Test Systems specializes in developing, manufacturing, and selling systems designed to reduce the cost of testing Dynamic Random Access Memory and other memory devices.
What sets them apart is that their systems enable integrated circuit manufacturers to perform test and burn-in of bare die.
AEHR is definitely a company worth keeping an eye on.
📈 Dive into the Technical Point for AEHR Stock Trading Strategy

● RSI and MACD Analysis
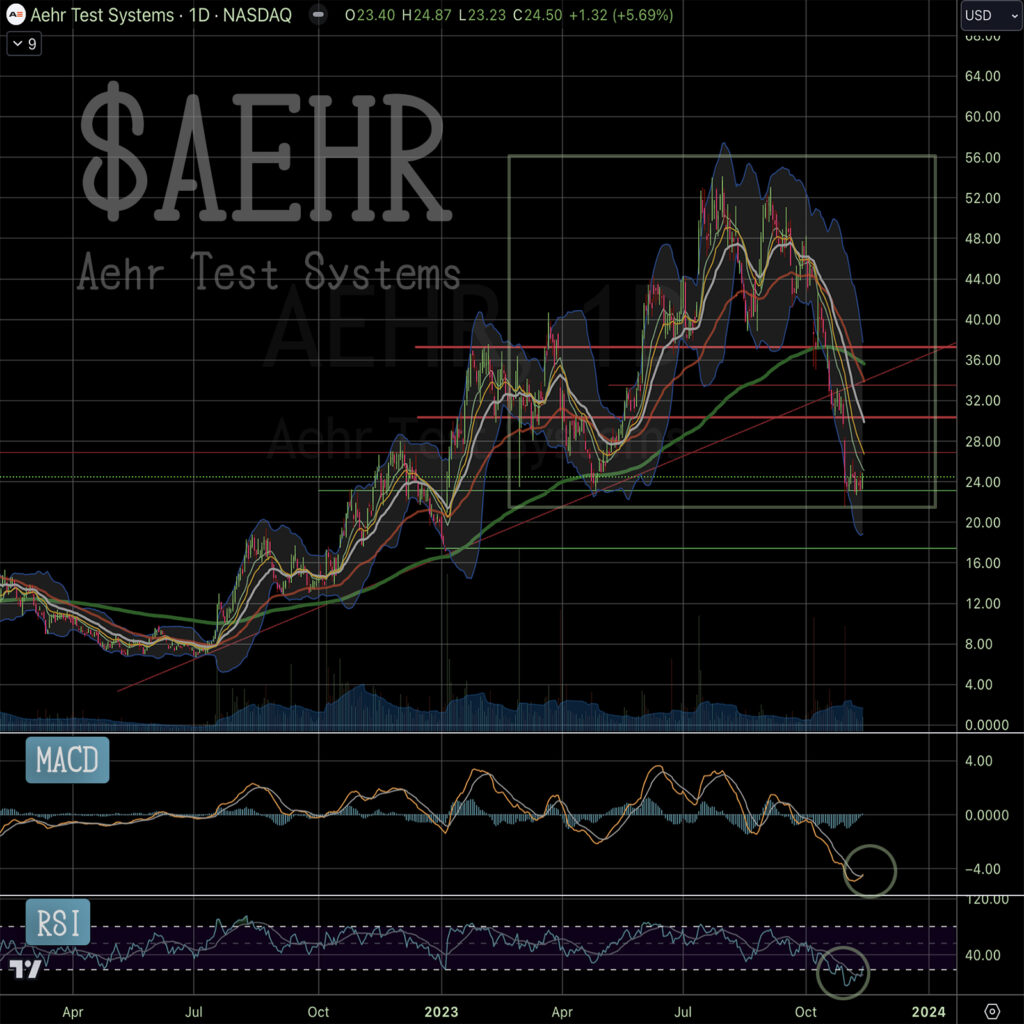
At the beginning of September, AEHR made an attempt to reach new highs but faced rejection, leading to a substantial drop. The Relative Strength Index (RSI) currently resides in the oversold zone, indicating potential buying opportunities, while the Moving Average Convergence Divergence (MACD) is forming a golden cross, a bullish signal. These technical indicators suggest a shift in momentum.
● Distance from 200-Day Exponential Moving Average (EMA)
AEHR’s stock price has significantly deviated from its 200-day Exponential Moving Average (EMA). The substantial distance between the two may imply a potential reversion to the mean, which often leads to price adjustments and reversals.
● Testing Former Bottom Support
Currently, AEHR is testing the support level established after the sharp drop. As long as the stock holds this support, there’s an expectation of a bounce in the coming week, potentially presenting an opportunity for traders and investors.
✏️ Chart Technical Tips
*Tendency of Stock Prices Return to EMA Lines*
One notable aspect of a successful stock trading strategy is that stock prices often exhibit a magnetic pull, returning to their Exponential Moving Average (EMA) lines when they deviate significantly.
When you look at a stock’s price chart, you might notice that the stock’s price seems to have a habit of returning to a certain line over time. This line is called the Exponential Moving Average (EMA).

Think of the EMA as a sort of gravitational pull for the stock’s price. It’s like a magnet that the price keeps coming back to.
For instance, in the case of Aehr Test Systems (AEHR), the stock’s price moved quite far away from its EMA line, which is typically calculated over a 200-day period. This significant gap between the stock’s price and its EMA indicates that there’s a high likelihood the stock may move back closer to the EMA line. It’s as if the stock is naturally drawn to this EMA line to find balance.
As a part of your stock trading strategy, this is a handy concept to understand. If you see a stock that’s moved far from its EMA, it might be a signal that it could head back in that direction. Paying attention to this can help you make smarter trading decisions. Just remember, stock prices like to find their way back to their EMA road to find balance. Keep an eye on this tendency as you make your stock trading strategy choices.”
And if you’re interested in delving deeper into this swing trading strategy, check the article “2 Simple Swing Trading Strategies of a Japanese Legend Trader: 20 Billion Yen in 8 Years.“
This article introduces a young Japanese legend trader who made a fortune using these trading techniques.
🏹 For Your Successful Trading Strategy
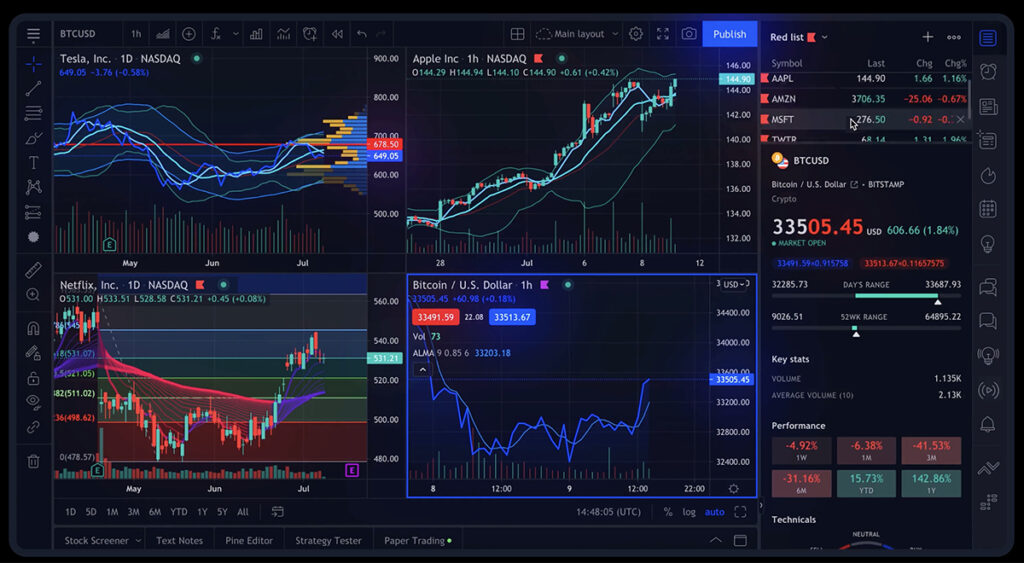
As we delve deeper into the world of stock market technical analysis, having access to reliable and comprehensive tools becomes paramount for making informed trading decisions. In my daily trading, I rely on TradingView, an exceptional platform for stock chart analysis.

TradingView offers a plethora of features and tools that empower traders and investors to conduct in-depth chart analysis for your stock trading strategy. To explore the benefits of TradingView, take a look my comprehensive review in the article “How TradingView Can Change the Game for Traders” You can also access the platform directly here.
🍵 Conclusion
In the world of stock trading, success is not a destination; it’s a journey. Mastering your stock trading strategy requires dedication, a keen understanding of market dynamics, and a commitment to continuous learning. As we’ve delved into the technical aspects of Aehr Test Systems (AEHR), we’ve unlocked the door to informed decision-making and the potential for substantial gains.
The key takeaways from this exploration of AEHR’s technicals, like RSI and MACD analysis, distance from the 200-day EMA, and support level testing, are valuable tools in your stock trading strategy arsenal. They provide you with the insights needed to seize opportunities and mitigate risks in the fast-paced world of stock trading.
However, it’s crucial to remember that no strategy is foolproof, and the market can be unpredictable. Even the most meticulously planned trades can sometimes result in losses. What sets successful traders apart is their ability to adapt and learn from both their victories and defeats.
In conclusion, while our focus has been on Aehr Test Systems and the technical aspects of stock trading, your journey as a trader is far-reaching. It’s an ongoing commitment to learning, adapting, and refining your skills. With the right mindset, tools, and strategy, you can navigate the complexities of the stock market and work towards your financial goals. Happy trading!
🌿 FAQs
Q1. What is the best way to start building a stock trading strategy?
Begin by establishing a strong educational foundation to start building your own stock trading strategy. Learn about various trading techniques, risk management, and market analysis. Dive deeper into stock market analysis through courses, books, webinars, and seminars.
As one option to enhance your technical analysis skills, consider exploring specialized online courses from StockOdds.

They offer a range of educational resources for both beginners and experienced traders. Check out our detailed review in the article titled: “Unveiling the Best Stock Trading Course: A Comprehensive Review of StockOdds“ to learn more about their offerings.
Q2. How can I choose the right stocks to include in my stock trading strategy?
Stock selection is a critical part of your stock trading strategy. Look for companies with strong fundamentals, a competitive edge in their industry, and potential for growth. Technical analysis can help pinpoint entry and exit points. Additionally, staying updated on market news and trends is essential for making informed choices.
Q3. How often should I review and adjust my stock trading strategy?
Market conditions change, and it’s crucial to regularly review and adjust your stock trading strategy accordingly. Many traders reassess their strategies weekly or monthly. If you notice that certain aspects of your strategy are consistently underperforming or market conditions change dramatically, it may be time to make adjustments.
Q4. What are some useful tools and resources for stock trading analysis?
There are several valuable tools and resources available, such as stock charting platforms like TradingView, financial news outlets like Bloomberg or CNBC, and brokerage platforms that offer research tools and analyst reports. Additionally, books, online courses, and forums can be excellent sources of knowledge and insight.
For a more comprehensive list of trading tools and resources, we recommend checking out the “trading resources” section on our blog.
Q5. How can I manage emotions in stock trading?
Emotions can influence trading decisions and lead to impulsive actions. To manage emotions, it’s important to set clear entry and exit points before making a trade and stick to your plan. Additionally, practicing mindfulness and maintaining a long-term perspective can help reduce the impact of emotions on your trading.
Q6. Is it possible to be successful in stock trading without prior experience?
While prior experience can be helpful, it’s not a requirement for success in stock trading. Many successful traders started with little to no experience and learned as they went along. The key is to educate yourself, start with small investments, and gain experience over time. Joining trading communities and seeking guidance from experienced traders can also be beneficial.
Q7. What are some common pitfalls to avoid in stock trading?
Common pitfalls in stock trading include overtrading, neglecting risk management, letting emotions dictate decisions, and failing to diversify your portfolio. It’s essential to be aware of these pitfalls and take steps to avoid them to improve your trading success.
Q8. Where can I access real-time stock chart?
When it comes to real-time stock charts, look no further than TradingView, a platform that I personally use and highly recommend.
TradingView is more than just a charting tool; it’s a comprehensive online trading platform that offers a rich toolkit for traders. With its user-friendly interface, a wide range of technical indicators, and the ability to customize your charts, it’s considered by many as the best platform for in-depth stock chart analysis.
Whether you’re a novice or an experienced trader, TradingView provides the real-time data and tools you need to make well-informed trading decisions in today’s dynamic market.
👉👉 Connect with Me: Instagram and StockTwits ✌️


