In the realm of trading, where each decision holds the potential to impact your success, comprehending the intricacies of the oil price chart is indispensable. These charts are not just instruments of analysis but keystones that influence economies and stock markets on a global scale.
Today, we embark on a journey to explore the technical chart analysis of CFDs on Crude Oil (Ticker: USOIL), shedding light on how a deep understanding of oil price charts can be your key to success in the trading world.
✏️ Table of Contents
🔔 Today’s Chart Pick
CFDs on Crude Oil (Ticker: USOIL)
Crude oil is not just a commodity; it’s a global economic driver. Its price fluctuations are influenced by a multitude of factors, including geopolitical events, supply and demand dynamics, and market sentiment. As a trader, understanding these factors is essential.
📈 Dive into the Oil Price Chart Technical Point

● Resistance Breakdown
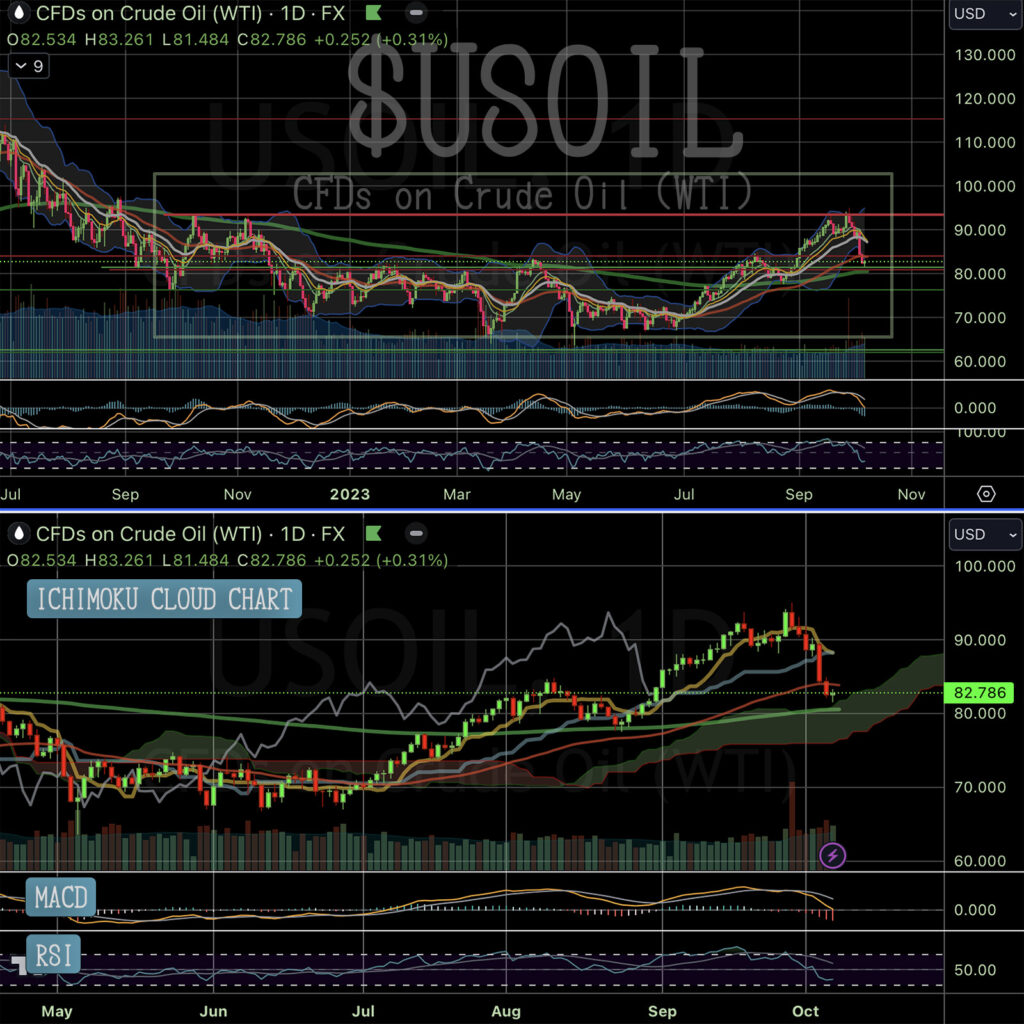
Towards the end of September, oil encountered a significant resistance level, leading to a sharp price decline. This resistance serves as a critical technical indicator that traders should closely monitor. Understanding how this resistance level affects price movements is essential for market analysis.
● Cup Formation
Oil’s current price action hints at the formation of a potential cup pattern on the oil price chart. This pattern could indicate a bullish trend if it continues to develop. However, it’s crucial to keep a vigilant eye on its evolution to confirm its significance and potential implications for trading decisions.
● Key Support Levels
Oil is currently testing three major support levels: the 200-day Exponential Moving Average (200dEMA), a crucial support level, and the KUMO (Ichimoku cloud). Grasping the dynamics of these support levels and their interactions with price movements is vital for informed trading decisions. In other words, oil needs to hold this zone; otherwise, if it drops, this zone turns into a major resistance.
● RSI Indicator
The Relative Strength Index (RSI) is nearing a historical bouncing point on the oil price chart, suggesting the potential for a rebound in the upcoming week. Monitoring RSI levels and their historical relationships with market sentiment can provide valuable insights into future price trends.
● Resistance Ahead
Oil is currently facing resistance from both the 50-day Exponential Moving Average (50dEMA) and a nearby resistance zone. Successfully breaking through this resistance zone is imperative for Oil to initiate a potential upward momentum.
💡 Chart Technical Tips
*200dEMA*
The 200-day Exponential Moving Average (200dEMA) is a key technical indicator in trading for several reasons. This is significant because the 200dEMA reflects a long-term average of price data, making it a robust measure of the underlying trend.
When an asset’s price is above the 200dEMA, traders consider it a key support level because it represents a consensus among market participants over an extended period.
Conversely, when the price is below the 200dEMA, it can function as a key resistance, signaling potential selling opportunities. Traders view the breach of the 200dEMA from above as a bearish signal, as it suggests a potential shift in the long-term trend. This makes it an important level for monitoring potential reversals.

The 200dEMA is widely used to assess long-term trends and identify potential reversal points in the market. It serves as a reference point for traders to gauge the overall health and direction of an asset’s price. Therefore, monitoring how a stock interacts with its 200dEMA can provide valuable insights into its future price direction and is a critical aspect of technical analysis for traders.
🏹 For The Success Of Your Trading
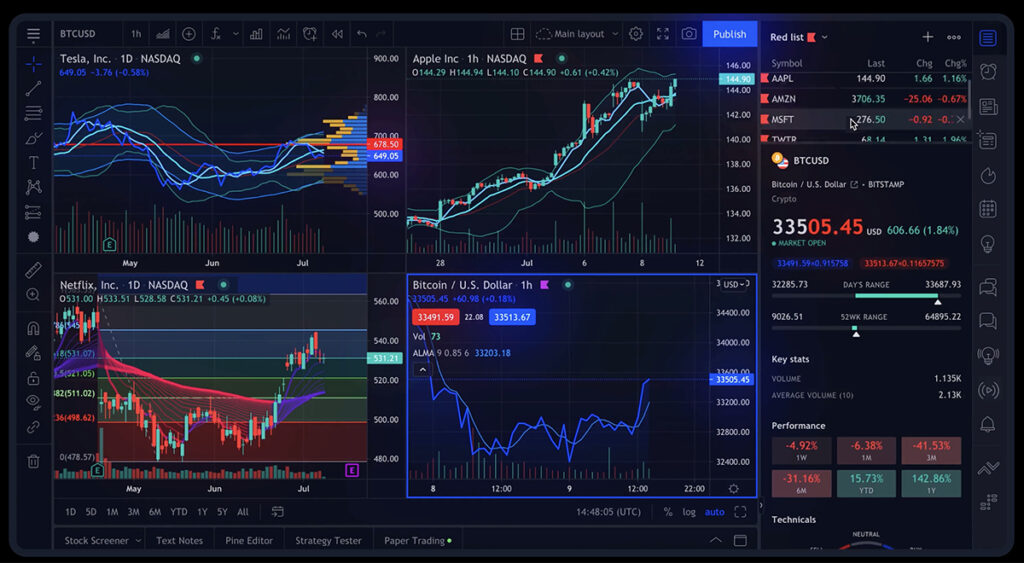
As we delve deeper into the world of stock market technical analysis, having access to reliable and comprehensive tools becomes paramount for making informed trading decisions. In my daily trading, I rely on TradingView, an exceptional platform for stock chart analysis.

TradingView offers a plethora of features and tools that empower traders and investors to conduct thorough chart analysis. To explore the benefits of TradingView, take a look my comprehensive review in the article “How TradingView Can Change the Game for Traders” You can also access the platform directly here.
🍵 Conclusion
In the ever-evolving world of trading, mastering the technical intricacies of oil price chart is a skill that can truly set you apart. From identifying critical resistance levels to interpreting chart patterns, every detail plays a pivotal role in making informed trading decisions. Trading is not just about numbers; it’s about understanding the narrative woven within the charts.
As you venture further into the dynamic realm of trading, remember that knowledge is your most potent ally. Equip yourself with insights, stay ever-vigilant, and may your trades always be guided by wisdom, leading to profitable endeavors in the trading world.
🌿 FAQs
Q1. What are CFDs on Crude Oil, and how do they work?
CFDs, or Contracts for Difference, are financial derivatives that allow traders to speculate on the price movements of Crude Oil without owning the actual commodity. When you trade CFDs on Crude Oil, you’re essentially entering into an agreement with a broker to exchange the difference in the asset’s price from the time you open the trade to the time you close it. Profit or loss is determined by the change in price.
Q2. How can I use technical analysis on oil price chart to improve my oil trading strategy?
Technical analysis involves studying historical price charts and patterns to predict future price movements. In the context of oil trading, you can use technical analysis on oil price chart to identify key support and resistance levels, chart patterns like cup formations, and technical indicators like the RSI. These tools can help you make more informed trading decisions.
Q3. What is the significance of the 200-day Exponential Moving Average (200dEMA) in trading?
The 200dEMA is a long-term moving average that provides insights into the overall trend of an asset’s price. When the price is above the 200dEMA, it often serves as a support level, indicating a bullish trend. Conversely, when the price is below the 200dEMA, it can act as resistance, suggesting a bearish trend. Traders use the 200dEMA to gauge the direction of a stock’s price.
Q4. How do I choose the right trading platform for analyzing oil price chart?
Selecting the right trading platform is crucial for effective chart analysis. Look for platforms that offer advanced charting tools, real-time data, and technical indicators for your oil price chart analysis. As mentioned in the article, TradingView is a popular choice among traders for its comprehensive features. Ultimately, the choice depends on your specific trading needs and preferences.
Q5. What should I keep in mind when trading CFDs on Crude Oil?
Trading CFDs on Crude Oil can be highly volatile and involves risk. It’s essential to have a well-defined trading strategy, set stop-loss orders to manage risk, and stay informed about global events that can impact oil prices. Additionally, continuously educate yourself on technical analysis to make more informed trading decisions.
Q6. Can I trade CFDs on Crude Oil without prior experience in trading?
While trading CFDs can be accessible to beginners, it’s essential to start with a solid understanding of trading concepts, risk management, and technical analysis for your oil price chart. Consider practicing with a demo account before trading with real money. Seek guidance from experienced traders or take educational courses to enhance your knowledge and skills.
Q7. Where can I find reliable resources for staying updated on oil market news and trends on the oil price chart?
Staying informed about the oil market is crucial for successful trading. You can rely on reputable financial news websites, industry publications, and market analysis reports to gather information on the oil price chart. Additionally, following official sources such as government energy agencies and the Organization of the Petroleum Exporting Countries (OPEC) can provide valuable insights into oil market developments.
Q8. How can I learn more about oil price chart technical analysis?
To dive deeper into oil price chart technical analysis, consider enrolling in online courses or reading books on the subject. There are also numerous YouTube channels and forums where traders share their insights.
Additionally, if you’re looking for a comprehensive online trading course, We recommend checking out StockOdds. They offer a range of educational resources and insights that can help you sharpen your stock market technical analysis skills.
Q9. Where can I access real-time oil price chart?
For real-time oil price chart, check out TradingView, which is what I’m using. It’s the best online trading platform, offering a comprehensive toolkit to traders!
👉👉 Connect with Me: Instagram and StockTwits ✌️


