In the world of stock market trading, mastering stock market technical analysis is key to success. Today, we focus on applying these analysis techniques to Natural Gas Price Chart (Ticker: NGAS), a significant commodity in the energy sector.
Join us as we delve into the intricacies of technical analysis to better understand and navigate the complexities of trading Natural Gas.
✏️ Table of Contents
🔔 Today’s Stock Pick
Natural Gas (Ticker: NGAS)
Natural Gas, often called the “hidden gem” of the trading world, holds untold potential for those willing to decipher its complexities. It’s influenced by diverse factors like weather patterns, global demand, and geopolitical events.
As we venture deeper into the realm of Natural Gas trading, we’ll reveal the captivating patterns and trends that govern its movements. We’ll explore how stock market technical analysis acts as our compass, helping us navigate through the market’s twists and turns.
📈 Dive into the Technical Point

● Breakout Analysis
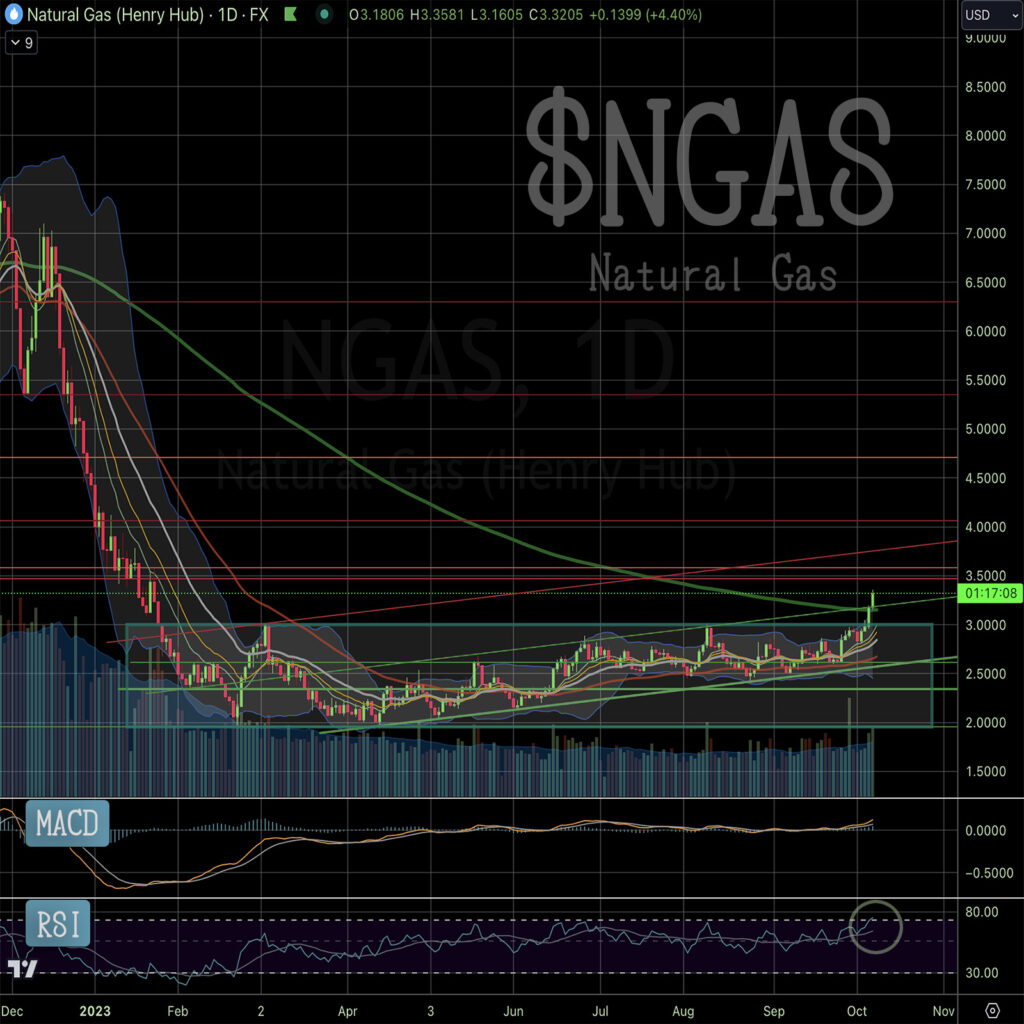
Natural Gas has recently taken a significant action by breaking out from a prolonged consolidation range, characterized by a box pattern. This breakout action signifies a potential surge in bullish momentum.
When a commodity like Natural Gas breaks free from a consolidation phase, it’s a clear indication that it has made a decisive move, shaking off market indecision. This action suggests that buyers are taking charge, potentially initiating an upward trend in Natural Gas prices. Traders and investors keenly observe such actions as they often present lucrative trading opportunities.
● Moving Average Indicator
In a noteworthy action, the price of Natural Gas has surged above its 200-day Exponential Moving Average (200dEMA). This action is pivotal in technical analysis, signifying a bullish development.
It implies that Natural Gas has shown enough strength in its recent price action to push the average higher. This action is typically interpreted positively by stock market technical analysts, indicating the likelihood of a continued bullish trend in Natural Gas.
● Cup Formation Potential
Natural Gas is showcasing an interesting action in the form of a potential Cup Chart pattern on its price chart. This action resembles the shape of a tea cup, characterized by a rounded bottom followed by a consolidation phase.
The Cup formation action suggests the potential for a bullish trend in the future. However, it’s essential to recognize that chart patterns like this one can evolve over time. Traders must closely monitor this action’s development to confirm whether it indeed leads to a bullish trend.
● RSI Overbought Zone
Despite its bullish actions, caution is warranted when examining Natural Gas Price Chart. The Relative Strength Index (RSI) has taken a significant action by entering the overbought zone. This action is indicative of potential overextension.
An overbought RSI often implies that the asset may be due for a pullback or correction. This action highlights the need for vigilance and readiness for potential short-term reversals in Natural Gas prices.
● Wait for Support
For traders considering entry or re-entry into the Natural Gas market, a patient approach is key. After a potential correction, it’s prudent to wait for Natural Gas to take action by finding support. Support levels are where Natural Gas typically encounters buying interest, preventing further price decline.
Waiting for this action of finding support can offer a more favorable entry point with reduced risk. This strategic action allows traders to avoid entering the market during volatile periods and potentially experiencing losses.
💡 Today’s stock market technical analysis tip
*Price Corrections*
Price corrections are like brief detours in the journey of an asset’s price. They can happen in two ways: the price can take a short break from going up, or it can pause when it’s going down. Think of it as a natural part of how financial markets work.
These corrections occur when an asset has been either rising too fast or falling too quickly. It’s like the market saying, “Hold on, let’s take a breather.”

During a correction, prices might go in the opposite direction of what they’ve been doing lately. This is normal and happens to keep things balanced. Traders use tools like trend lines or moving averages to figure out when and where these corrections might end.
Now, why are corrections interesting? Well, they create opportunities for investors. If you missed buying or selling at a certain price, a correction can give you a second chance. Traders also use corrections to make short-term profits when prices bounce back up or down. So, whether the price has been going up or down, corrections are like little pauses in the market’s journey that everyone can benefit from.
🏹 For The Success Of Your Trading
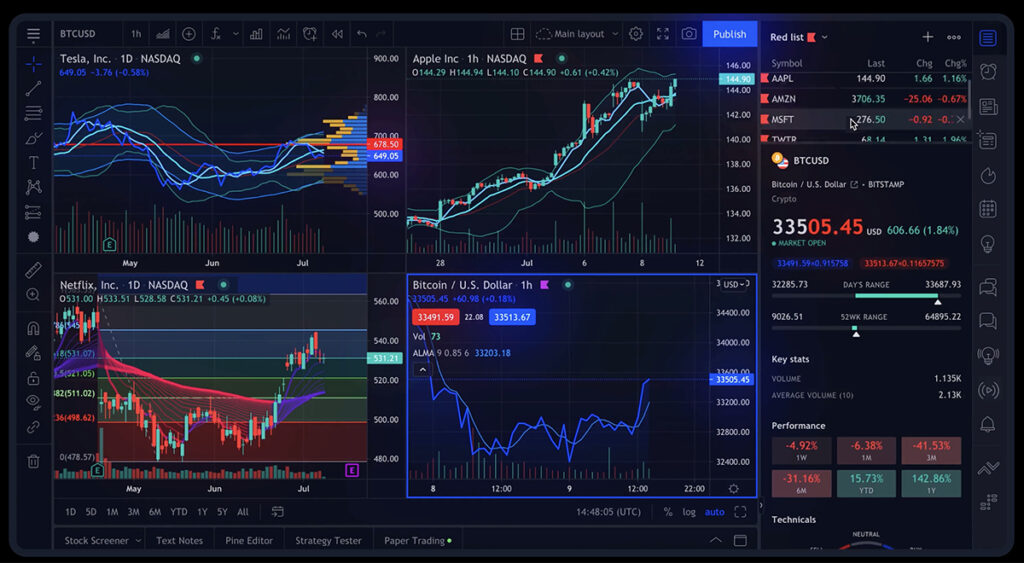
As we delve deeper into the world of stock market technical analysis, having access to reliable and comprehensive tools becomes paramount for making informed trading decisions. In my daily trading, I rely on TradingView, an exceptional platform for stock chart analysis.

TradingView offers a plethora of features and tools that empower traders and investors to conduct thorough chart analysis. To explore the benefits of TradingView, take a look my comprehensive review in the article “How TradingView Can Change the Game for Traders” You can also access the platform directly here.
🍵 Conclusion
In the vast expanse of the stock market, we’ve unraveled the fascinating world of Natural Gas (Ticker: NGAS) trading through the lens of stock market technical analysis.
Throughout our journey in the realm of stock market technical analysis, we’ve uncovered key technical points, including breakout actions, the significance of the 200-day Exponential Moving Average, potential cup formations, and the watchful eye on the RSI’s overbought zone. These insights equip us to make informed trading decisions, whether we’re seizing opportunities during price corrections or patiently waiting for support levels.
Now, equipped with the knowledge gleaned from this journey, you’re better prepared to navigate the Natural Gas trading landscape. Whether you’re a seasoned trader or just starting, may your trading endeavors be guided by wisdom and strategy, ensuring a successful path in this captivating market.
🌿 FAQs
Q1. Why is stock market technical analysis effective for stock trading?
stock market technical analysis proves effective in stock trading due to its structured approach in analyzing historical price data and patterns. It offers traders valuable insights into potential trends, optimal entry and exit points, and the ability to effectively manage risks. By understanding price patterns and utilizing various indicators, traders can make informed decisions, enhancing their trading strategies and overall success in the stock market.
Q2. What is the significance of the 200-day Exponential Moving Average (200dEMA) in NGAS technical analysis?
The 200dEMA is a key indicator that provides insights into the long-term trend of NGAS prices. When NGAS prices rise above this moving average, it’s often considered a bullish signal, suggesting a potential uptrend.
Q3. Can you explain the cup pattern mentioned in the article?
A cup pattern in technical analysis resembles the shape of a tea cup with a rounded bottom. It indicates a potential bullish trend in the future. Traders look for this pattern to spot opportunities for buying NGAS.
Q4. How can I identify a correction in a stock’s price?
A correction in a stock’s price is often characterized by a temporary decline after a significant upward move. You can identify it by observing price retracements and looking for signs of support levels being tested.
Q5. What is the Relative Strength Index (RSI)?
The Relative Strength Index (RSI) is a momentum oscillator that measures the speed and change of price movements. It ranges from 0 to 100 and is used to identify overbought or oversold conditions in an asset’s price.
Q6. What should I do if the Relative Strength Index (RSI) enters the overbought zone for NGAS?
An overbought RSI suggests caution. It may be prudent to expect a potential pullback or correction in NGAS prices. Traders should consider waiting for a more favorable entry point with reduced risk.
Q7. How often should I review NGAS technical analysis to make informed trading decisions?
Regular review of NGAS technical analysis is crucial for staying updated on price movements and market conditions. Traders often analyze charts on a daily or weekly basis, but the frequency may vary based on your trading style and goals.
Q8. How can I learn more about stock market technical analysis?
To dive deeper into stock market technical analysis, consider enrolling in online courses or reading books on the subject. There are also numerous YouTube channels and forums where traders share their insights.
Additionally, if you’re looking for a comprehensive online trading course, We recommend checking out StockOdds. They offer a range of educational resources and insights that can help you sharpen your stock market technical analysis skills.
Q9. Where can I access real-time stock charts?
For real-time stock charts, check out TradingView, which is what I’m using. It’s the best online trading platform, offering a comprehensive toolkit to traders!
👉👉 Connect with Me: Instagram and StockTwits ✌️


