Hi there, fellow traders and investors! Today’s spotlight is on Tesla, Inc (Ticker: TSLA), a company that has been making waves in the market. In this article, we’ll delve into the technical chart analysis of TSLA’s stock chart and explore some insightful chart reading tips. So grab your coffee, because we’re about to dive deep into the world of stock charts.
🔔 Today’s Stock Pick
Tesla, Inc (Ticker: TSLA)
Tesla, Inc (Ticker: TSLA) has been captivating the market with its innovative electric vehicles and renewable energy solutions. As of late, its stock performance has been equally captivating, leaving investors eager to decipher its next move.
📈 Dive into the Technical Point

👉 Looking For The Best Online Trading Chart Platform? Check What I’m Using (Pro+)
● Cup and Handle Formation
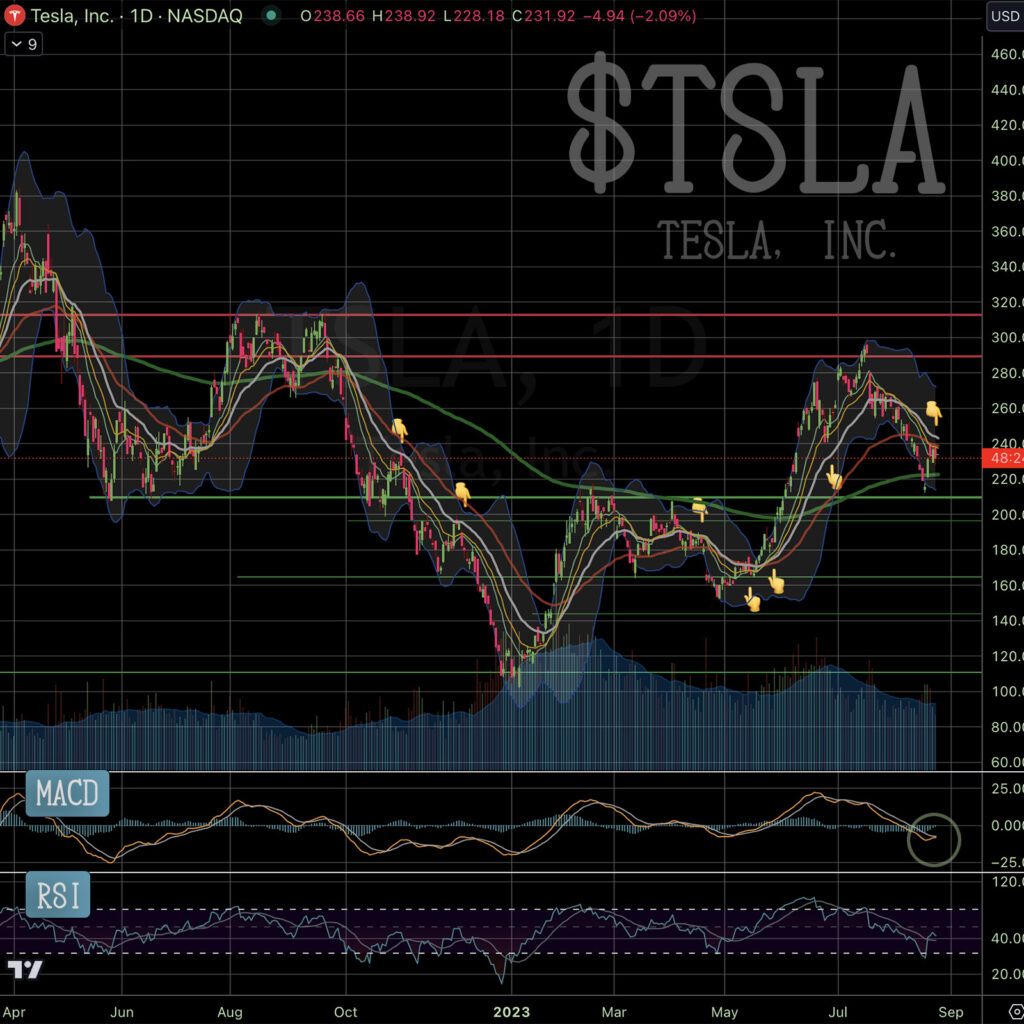
One intriguing pattern emerging on TSLA’s chart is the cup and handle formation. This bullish continuation pattern has become a favorite among chart enthusiasts. At present, TSLA is in the process of forming the right handle of this pattern, suggesting potential positive momentum.
● Key EMA Resistance/Support
Keep a keen eye on the 25-day Exponential Moving Average (25dEMA), illustrated as a gray line on the chart. This line seems to be playing a pivotal role as a resistance and support zone. Investors often watch how stock prices interact with this moving average to gauge potential shifts in trend.
● Challenge to 25dEMA
After rebounding from a significant support level, TSLA is now facing the challenge of breaching the 25dEMA. This juncture holds significant importance as it could signal a potential shift in sentiment and pave the way for further price movement.
● MACD Golden Cross
Technical analysts will be pleased to note that the MACD indicator is indicating a golden cross formation. This bullish signal occurs when the MACD line crosses above the signal line, hinting at the possibility of upward momentum in TSLA’s price trajectory.
💡 Chart Technical Tips
*MACD Forming Golden Cross*
One of the standout technical indicators for TSLA is the Moving Average Convergence Divergence (MACD) forming a golden cross. This optimistic signal is generated when the MACD’s faster-moving line (MACD line) crosses above the slower-moving line (signal line). Such a crossover suggests the potential for price appreciation and an uptick in bullish sentiment.
🏹 For The Success Of Your Trading
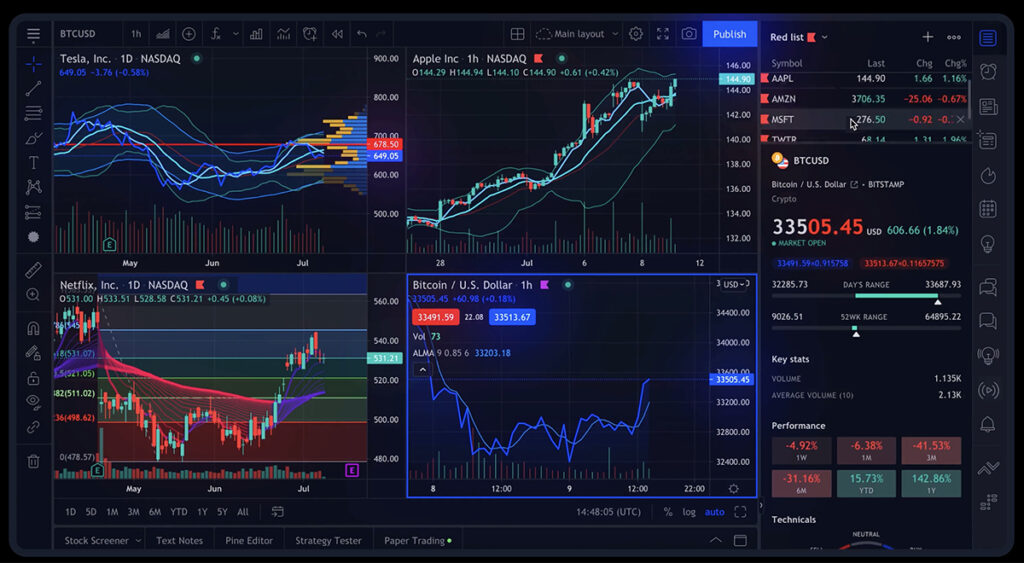
As we embark on this stock analysis journey, having access to reliable and comprehensive tools is crucial for making informed trading decisions. I am using TradingView, a platform that stands out in the realm of stock chart analysis.

This robust online trading platform offers a wide array of features and tools that empower traders and investors to conduct thorough chart analysis. To read my comprehensive review of TradingView, 👇🏽👇🏿check out this article:
“How TradingView Can Change the Game for Traders“
To explore the advantages of TradingView, feel free to access the platform here.
🍵 Conclusion
In conclusion, TSLA’s stock chart is a canvas of possibilities for astute investors. The cup and handle formation, the significance of the 25dEMA, the challenge it presents, and the MACD golden cross all hint at an intriguing journey ahead. Remember, while these indicators provide insights, no analysis is foolproof in the ever-changing stock market landscape.
🌿 FAQs
1. What is the significance of the cup and handle pattern?
The cup and handle pattern is a bullish continuation pattern that suggests a potential upward price movement in a stock’s chart.
2. How does the 25dEMA impact stock prices?
The 25-day Exponential Moving Average (25dEMA) serves as a crucial support and resistance zone, often influencing price movements.
3. What does a MACD golden cross indicate?
A MACD golden cross occurs when the faster-moving MACD line crosses above the signal line, pointing to potential bullish momentum.
4. Can technical analysis predict stock prices with certainty?
While technical analysis offers valuable insights, stock prices are influenced by a myriad of factors, making certainty elusive.
5. Where can I access real-time TSLA stock charts?
For real-time TSLA stock charts, check TradingView, which is what I’m using. It’s the best online trading platform, offering a comprehensive toolkit to traders!
👉 👉 Connect with Me: Instagram and StockTwits ✌️


