Hi there, fellow traders and investors! Welcome to a deep dive into the world of stock chart analysis. In this article, we’ll unravel the intriguing journey of Upstart Holdings, Inc (Ticker: UPST), shedding light on its recent market performance, technical aspects, and potential trading insights. So, let’s embark on this enriching exploration!
🔔 Today’s Stock Pick
Upstart Holdings, Inc (Ticker: UPST)
Upstart Holdings, Inc is an innovator in financial technology. Based in San Mateo, California, Upstart has redefined lending since 2012 with its AI-powered platform. Bridging consumer loan demand and AI-driven banks, Upstart offers efficient, personalized lending. This dynamic approach has revolutionized lending and captured the finance sector’s spotlight.
📈 Dive into the Technical Point

👉 Looking For The Best Online Trading Chart Platform? Check What I’m Using (Pro+)
● Support Test & 200dEMA Resistance
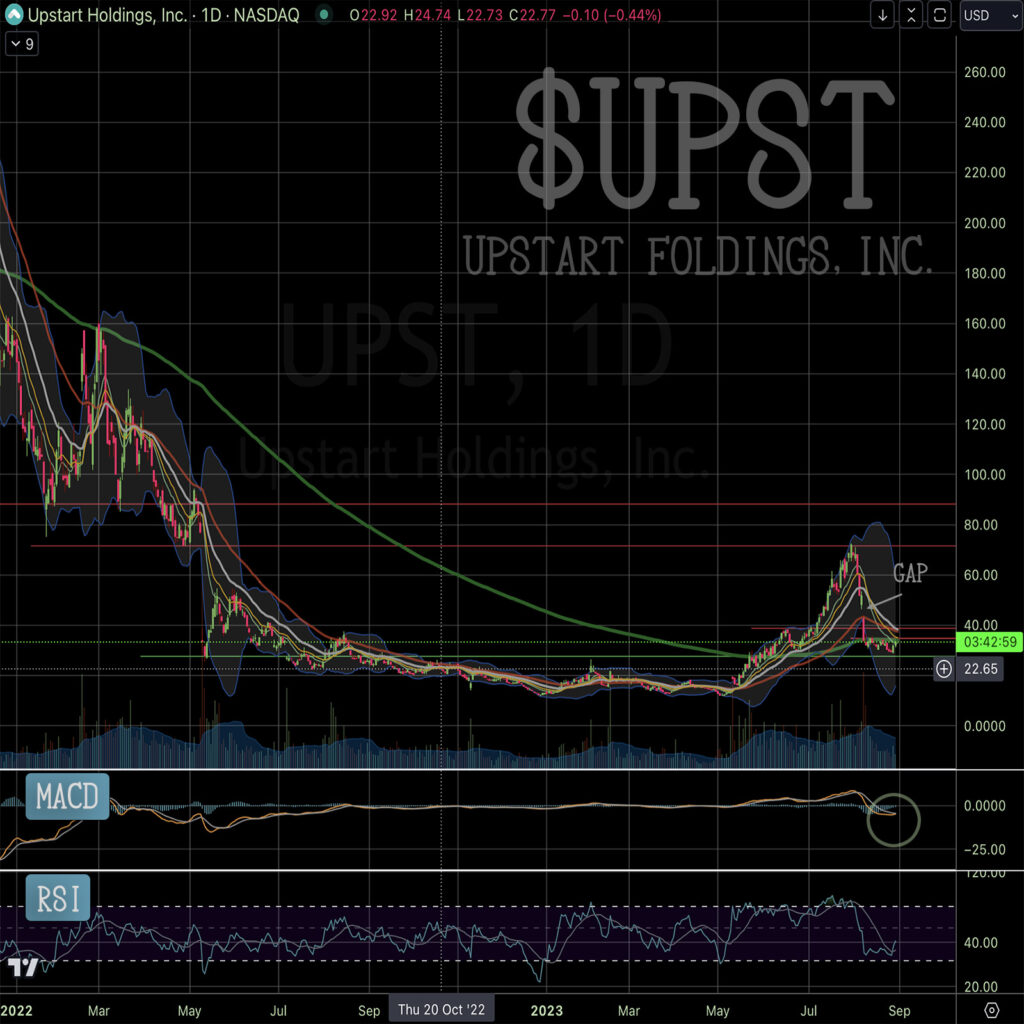
Following a bullish streak from May, UPST encountered resistance on August 1st, leading to a subsequent decline. Currently, the stock is in a support-testing phase, but the imposing 200-day Exponential Moving Average (200dEMA) continues to act as a formidable resistance. Analyzing the interplay between these factors provides invaluable clues about UPST’s potential trajectory.
● Aug. 9 Downward Gap & Behavior
A notable event occurred on August 9th as UPST experienced a downward price gap due to an overnight plunge. These gaps often leave behind future support or resistance levels. Traders have observed that stocks tend to revisit these gaps, magnetically drawn back to these levels due to shifts in supply and demand dynamics.
● MACD & Potential Golden Cross
The Moving Average Convergence Divergence (MACD) is a key indicator in UPST’s analysis, signaling momentum shifts and potential trend reversals. Currently, the MACD, after a drop, is lifting its head and forming a curl. This suggests the potential for a bullish momentum shift. Furthermore, the emergence of a “golden cross”—where the shorter-term moving average crosses above the longer-term one—hints at a positive trend reversal on the horizon.
💡 Chart Technical Tips
*Gap Pattern and Gap Filling*
The technical chart pattern known as a “gap” emerges when there’s a substantial disparity between a stock’s closing price and its opening price on consecutive trading days. These gaps can be classified into different types, including “upward gaps” and “downward gaps.”
Gaps are captivating due to their tendency to be revisited or “filled” in subsequent trading sessions. This intriguing behavior stems from the notion that gaps signify areas of supply-demand imbalance. Consequently, prices often gravitate back toward the gap zone to establish a more equilibrium-driven price level. Traders and analysts keenly monitor these gap-filling processes as potential indicators of short-term support or resistance levels.
Understanding gap patterns and their subsequent filling can provide invaluable insights into a stock’s price behavior. This understanding empowers traders with strategic opportunities, leveraging the recurring nature of this phenomenon.
🏹 For The Success Of Your Trading
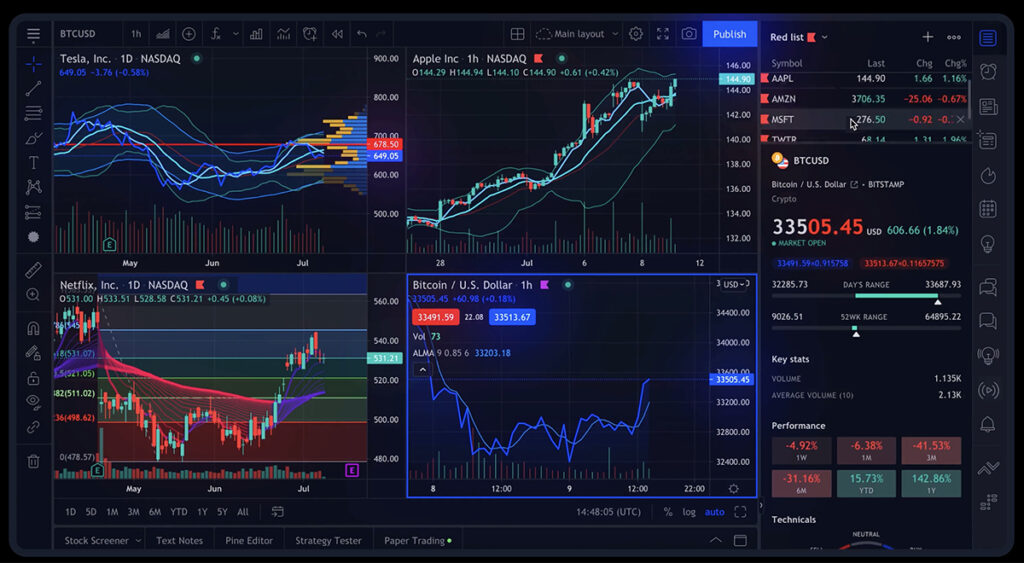
As we embark on this stock analysis journey, having access to reliable and comprehensive tools is crucial for making informed trading decisions. I am using TradingView, a platform that stands out in the realm of stock chart analysis.

This robust online trading platform offers a wide array of features and tools that empower traders and investors to conduct thorough chart analysis. To read my comprehensive review of TradingView, 👇🏽👇🏿check out this article:
“How TradingView Can Change the Game for Traders“
To explore the advantages of TradingView, feel free to access the platform here.
🍵 Conclusion
In this comprehensive exploration, we delved into the dynamic world of Upstart Holdings, Inc and its revolutionary AI-driven lending platform. The technical analysis journey shed light on key aspects of UPST’s chart, from support testing to MACD indicators and gap patterns. With insights into these factors, traders are better equipped to make informed decisions.
Remember, successful trading demands a harmonious blend of technical insights, reliable tools, and a keen awareness of market dynamics. As you chart your path in the stock market, may your decisions be guided by knowledge and strategic acumen.
🌿 FAQs
1. What is UPST’s recent performance?
UPST exhibited a bullish run followed by a decline, currently testing a significant support level.
2. What is the significance of the 200dEMA?
The 200-day Exponential Moving Average (200dEMA) acts as a formidable resistance for UPST.
3. How does gap filling work?
Gaps in stock charts often get “filled” as prices return to the gap zone, reflecting supply and demand balance.
4. What is the MACD indicator showing for UPST?
The MACD is indicating potential upward momentum and the possibility of a “golden cross.”
5. Where can I access real-time UPST stock charts?
For real-time UPST stock charts, check TradingView, which is what I’m using. It’s the best online trading platform, offering a comprehensive toolkit to traders!
👉 👉 Connect with Me: Instagram and StockTwits ✌️


