Are you seeking to enhance your stock market trading skills and boost your success rate through the power of stock technical analysis?
Unlocking the world of technical analysis is your gateway to understanding and mastering the art of making informed trading decisions.
In this article, we’ll explore the intricacies of stock technical analysis, with a focus on Gold Spot / U.S. Dollar ($XAUUSD), a valuable asset for traders. Let’s begin our journey into the world of stock analysis.
✏️ Table of Contents
🔔 Today’s Chart Pick
Gold Spot / U.S. Dollar ($XAUUSD)
Gold, known as the ‘precious metal,’ holds a unique position in finance due to its sensitivity to economic factors, geopolitical events, and inflation. Understanding gold’s chart patterns, support levels, and key indicators is essential for traders seeking to capitalize on its price fluctuations. In the following sections, we’ll explore how stock technical analysis can enhance your success in trading gold.
📈 Dive into Stock Technical Analysis

👉 Looking For The Best Online Trading Chart Platform? Check What I’m Using (Pro+)
● Gold’s Falling Wedge Formation
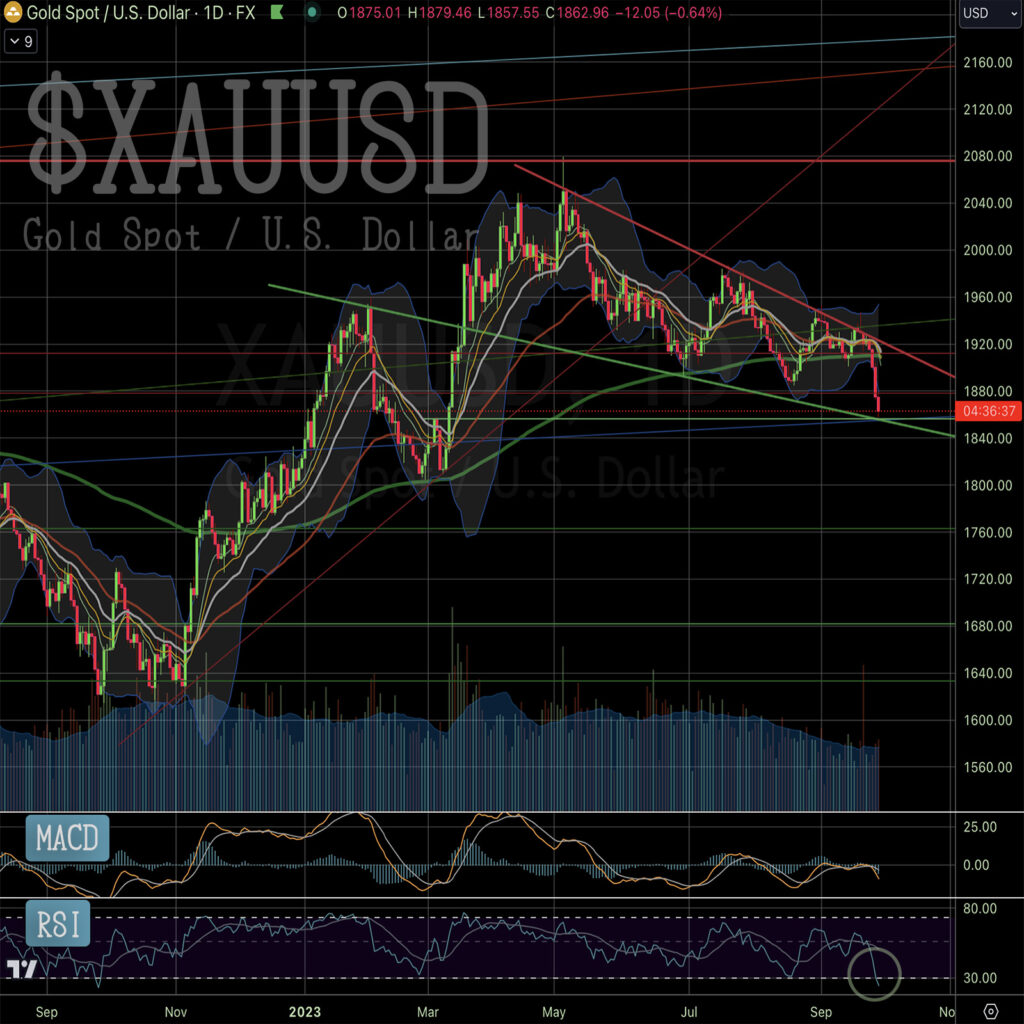
Gold is currently caught in the intriguing grip of a technical pattern known as a “falling wedge.” This pattern unfolds as a series of lower highs and lower lows, gradually converging to create a wedge shape on the chart. Gold’s recent descent has brought it to the lower boundary of this wedge, potentially signaling a significant turning point in its price trajectory.
● Support Level
Remarkably, within this falling wedge pattern, an intriguing possibility emerges. The resistance level formed on March 6th, which was previously a barrier, could now transform into a support for gold’s price. This reversal of roles opens the door to a potential bullish upswing in gold’s value.
● RSI in Oversold Territory
Adding to the intrigue, the Relative Strength Index (RSI), a widely followed momentum indicator, has ventured into oversold territory. This suggests that the intense selling pressure experienced by gold might be on the brink of yielding to renewed buying interest, potentially setting the stage for a rebound.
● Short-Term Bounce Play
Traders and investors are keeping a close eye on this setup, anticipating a potential short-term bounce. If gold manages to find support within the falling wedge and RSI indicators show signs of improvement, we could witness a swift ascent towards the wedge’s upper boundary.
● Long-Term Perspective
While the short-term presents opportunities, it’s crucial to maintain a long-term outlook. Gold’s overall trajectory remains confined within the boundaries of the falling wedge. For a substantial change in direction, gold must break free from this wedge pattern decisively.
💡 Chart Technical Tips
*Falling Wedge*
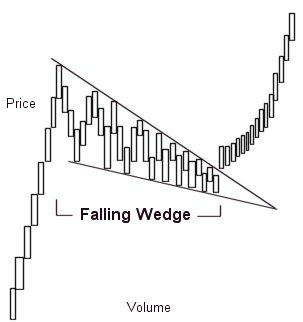
The falling wedge is a classic chart pattern renowned for hinting at potential trend reversals.

Image by Wikipedia: by Altafqadir (talk)CC by 3.0, Link
This pattern, one of the key aspects of stock technical analysis, manifests as a series of lower highs and lower lows, gradually converging to create a wedge shape on the chart. It often serves as a bullish signal, indicating that the previous downtrend may be losing steam. Traders closely monitor this pattern, with an eye on a breakout above the wedge’s upper boundary as a potential sign of an impending upward price movement.
Remember that while falling wedges are generally bullish indicators in stock technical analysis, prudent traders consider multiple factors before making their trading decisions.
🏹 For The Success Of Your Trading
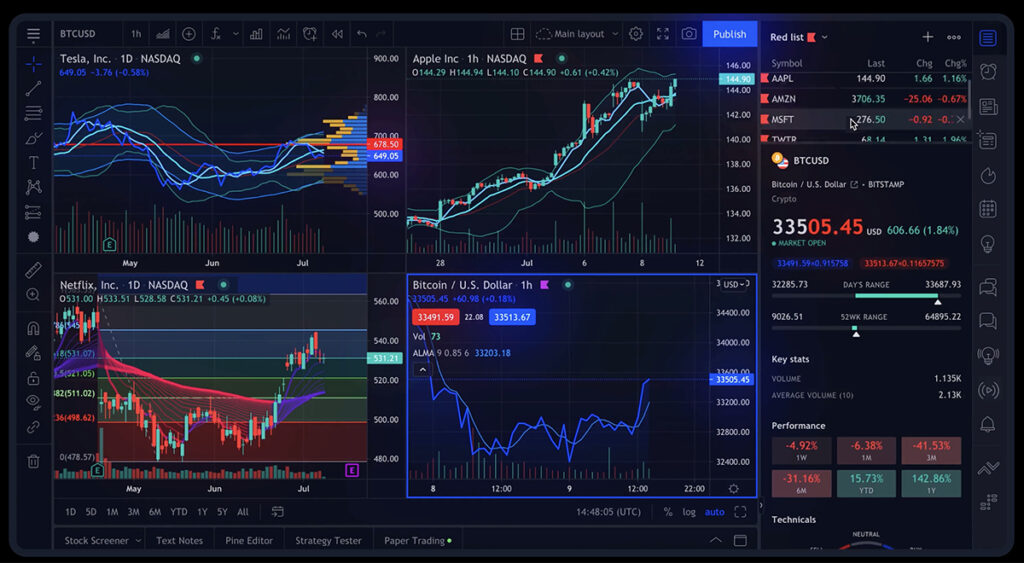
As we delve deeper into the world of stock technical analysis, having access to reliable and comprehensive tools becomes paramount for making informed trading decisions. In my daily trading, I rely on TradingView, an exceptional platform for stock chart analysis.

TradingView offers a plethora of features and tools that empower traders and investors to conduct thorough chart analysis. To explore the benefits of TradingView, take a look my comprehensive review in the article “How TradingView Can Change the Game for Traders” You can also access the platform directly here.
🍵 Conclusion
In conclusion, mastering the art of stock technical analysis opens the door to more informed and potentially profitable trading decisions. Today, we delved into the intricacies of the falling wedge pattern, with a specific focus on its application to Gold Spot / U.S. Dollar ($XAUUSD). As you navigate the dynamic world of stock trading, remember that understanding and utilizing technical analysis can be a powerful ally in your quest for success.
🌿 FAQs
Q1. What is stock technical analysis, and why is it important for traders?
Technical analysis evaluates securities by analyzing statistical trends and historical trading data, such as price charts, volume, and indicators. It’s vital for traders because it offers insights into market sentiment and aids in identifying entry and exit points, enhancing decision-making and trading success.
Q2. What are common technical indicators in analysis?
Common technical indicators include moving averages, RSI (Relative Strength Index), MACD (Moving Average Convergence Divergence), Bollinger Bands, and Fibonacci retracement levels. These tools help assess market trends, volatility, momentum, and potential reversals, adapting to various trading strategies.
Q3. How can traders use stock technical analysis effectively?
To boost trading performance:
Identify trends: Spot price trends for higher probability trades.
Set entry and exit points: Determine optimal points, reducing impulsive decisions.
Manage risk: Utilize historical data for effective risk management.
Combine with fundamental analysis: Blend both analyses for comprehensive insights.
Continuous learning: Stay updated on tools and strategies to adapt and refine skills.
Q4. How can I learn more about stock technical analysis?
To dive deeper into technical analysis, consider enrolling in online courses or reading books on the subject. There are also numerous YouTube channels and forums where traders share their insights.
Additionally, if you’re looking for a comprehensive online trading course, I recommend checking out StockOdds. They offer a range of educational resources and insights that can help you sharpen your technical analysis skills.
Q5. Where can I access real-time stock charts?
For real-time stock charts, check out TradingView, which is what I’m using. It’s the best online trading platform, offering a comprehensive toolkit to traders!
👉👉 Connect with Me: Instagram and StockTwits ✌️


