Hi there, fellow traders and investors! Today, in this article, I’ll be sharing technical chart analysis and some valuable insights about the recent movements of Natural Gas (Ticker: NGAS). Whether you’re a seasoned pro or just getting started, understanding how to read stock charts and spot potential trends can give you a real edge. So, let’s jump right in and take a closer look at NGAS.
🔔 Today’s Stock Pick
Natural Gas (Ticker: NGAS)
So, what’s caught my eye today? It’s Natural Gas, represented by the ticker symbol NGAS. I’ve been closely watching its price movements, and I’m eager to share my thoughts on its technical points and chart technical tips. If you’re as intrigued as I am, keep reading for the full scoop.
📈 Dive into the Technical Point

👉 Looking For The Best Online Trading Chart Platform? Check What I’m Using (Pro+)
● Box Pattern & Breakout Potential
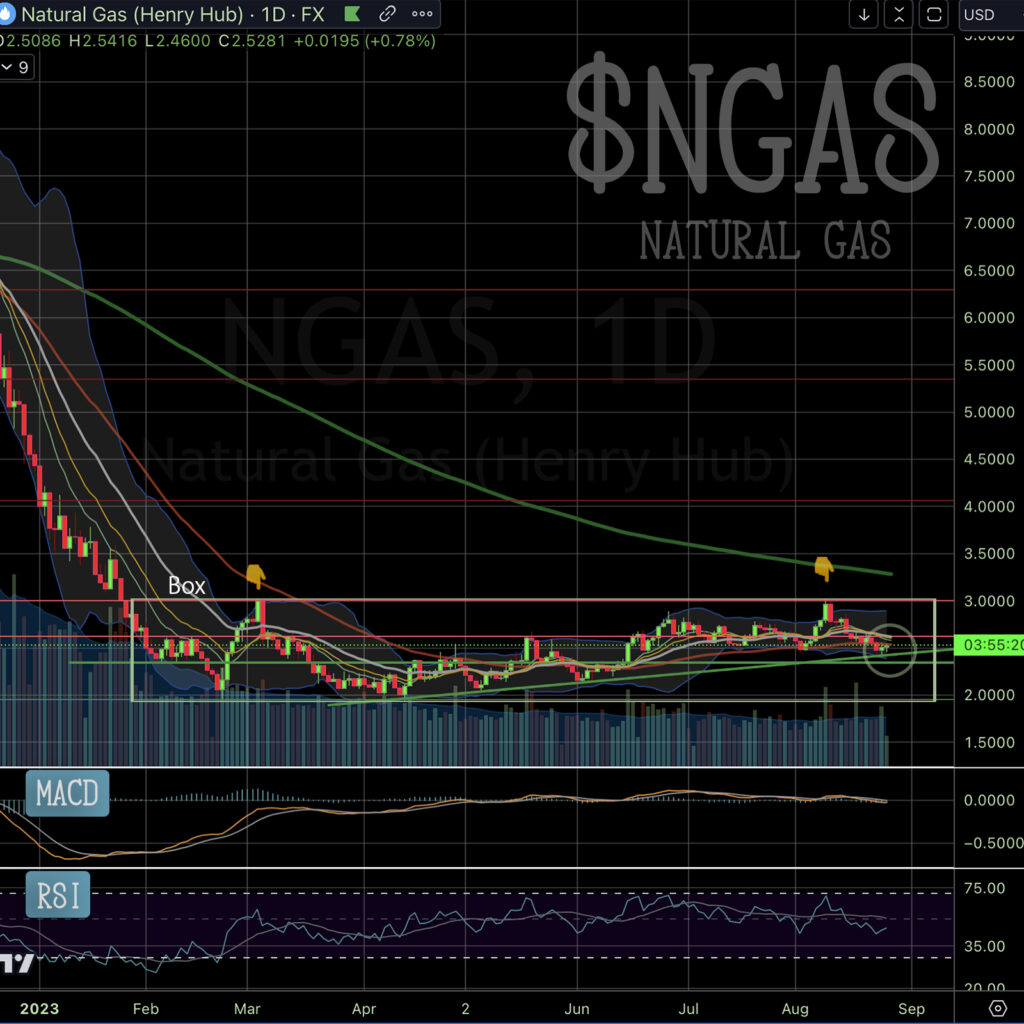
Alright, let’s talk about the box pattern I’ve been observing in NGAS’s chart. Picture a game of ping pong – that’s kind of what NGAS’s price is doing, bouncing between a specific range. This pattern is a sign of consolidation, where the price is taking a breather. Now, what’s got me excited is the possibility of a breakout. A breakout happens when the price breaks through the boundaries of the box pattern. If this happens, it could mean we’re in for a bullish ride. But here’s the thing – we can’t be too certain about this breakout just yet.
● Trend Line Test
Back on August 10th, NGAS tried to push through the upper boundary of the box pattern. Unfortunately, it got knocked back, and we saw the price drop afterward. Now, what’s happening is that the price is testing the trend line support within the box. This is a pretty significant moment because it could determine whether we’re looking at a breakout or not.
● EMAs Resistance
I’ve noticed that no matter how hard the price of NGAS tries, those Exponential Moving Averages (EMAs) are playing hard to get. They’re positioned above the current price level, forming a kind of barricade. Breaking out of the box pattern means breaking through this resistance zone set up by the EMAs.
💡 Chart Technical Tips
* Box (Rectangle) Pattern*
Let’s talk about the box pattern – it’s like a rectangle on the chart. During this phase, the price moves within a specific range horizontally. This indicates consolidation, where buyers and sellers are sort of taking a breather. When the price breaks out of this range, it could signal a change in trend. Traders often look at indicators like volume to figure out how strong the breakout is.
🏹 For The Success Of Your Trading
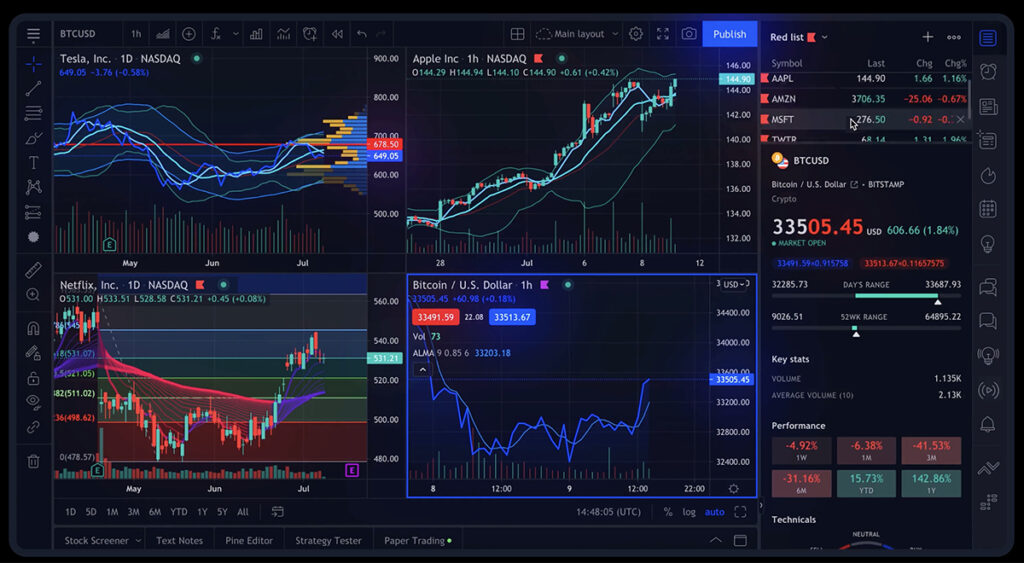
As we embark on this stock analysis journey, having access to reliable and comprehensive tools is crucial for making informed trading decisions. I am using TradingView, a platform that stands out in the realm of stock chart analysis.

This robust online trading platform offers a wide array of features and tools that empower traders and investors to conduct thorough chart analysis. To read my comprehensive review of TradingView, 👇🏽👇🏿check out this article:
“How TradingView Can Change the Game for Traders“
To explore the advantages of TradingView, feel free to access the platform here.
🍵 Conclusion
And there you have it, folks! I’ve shared my thoughts on NGAS’s potential breakout based on its recent chart behavior.
So, what’s the bottom line after all this analysis? Well, NGAS’s box pattern is a major player here. Keep an eye on how the price behaves near the edges of the box. If it manages to break out, we could be looking at a significant price move. On the flip side, if the breakout doesn’t happen, we might see more of the same consolidation.
Remember, while technical analysis is valuable, it’s just one piece of the puzzle. Always make informed decisions by considering the bigger picture and market dynamics. Stay connected for more of my stock chart reading insights and updates right here on my blog!
🌿 FAQs
1. What’s this box pattern everyone’s talking about?
The box pattern is a rectangle-shaped movement within a price range. It’s a sign that the price is taking a breather before potential future moves.
2. How can I tell if a breakout is strong?
Look at indicators like volume – higher volume during a breakout suggests stronger momentum.
3. Why does the trend line test matter?
The trend line test helps us understand if a breakout is on the horizon or if the current pattern will continue.
4. Can analyzing stock charts predict exact future prices?
Nope, stock chart analysis gives us insights, but it’s not a crystal ball for future prices.
5. Where can I access real-time NGAS stock charts?
For real-time NGAS stock charts, check TradingView, which is what I’m using. It’s the best online trading platform, offering a comprehensive toolkit to traders!
👉 👉 Connect with Me: Instagram and StockTwits ✌️


