Hi there, fellow traders and investors! If you’re seeking insights into the world of stock chart analysis and tips for interpreting stock charts effectively, you’ve come to the right place. In this article, we’ll be delving into the intriguing world of stock chart analysis using a recent example: Riot Platforms, Inc (Ticker: RIOT).
🔔 Today’s Stock Pick
Riot Platforms, Inc (Ticker: RIOT)
Riot Platforms, Inc is a company operating in the cryptocurrency space, particularly in relation to Bitcoin. The company’s stock performance is closely tied to the fluctuations in the cryptocurrency market, making it an interesting case study for stock chart analysis.
📈 Dive into the Technical Point

👉 Looking For The Best Online Trading Chart Platform? Check What I’m Using (Pro+)
● Bitcoin’s Impact Today
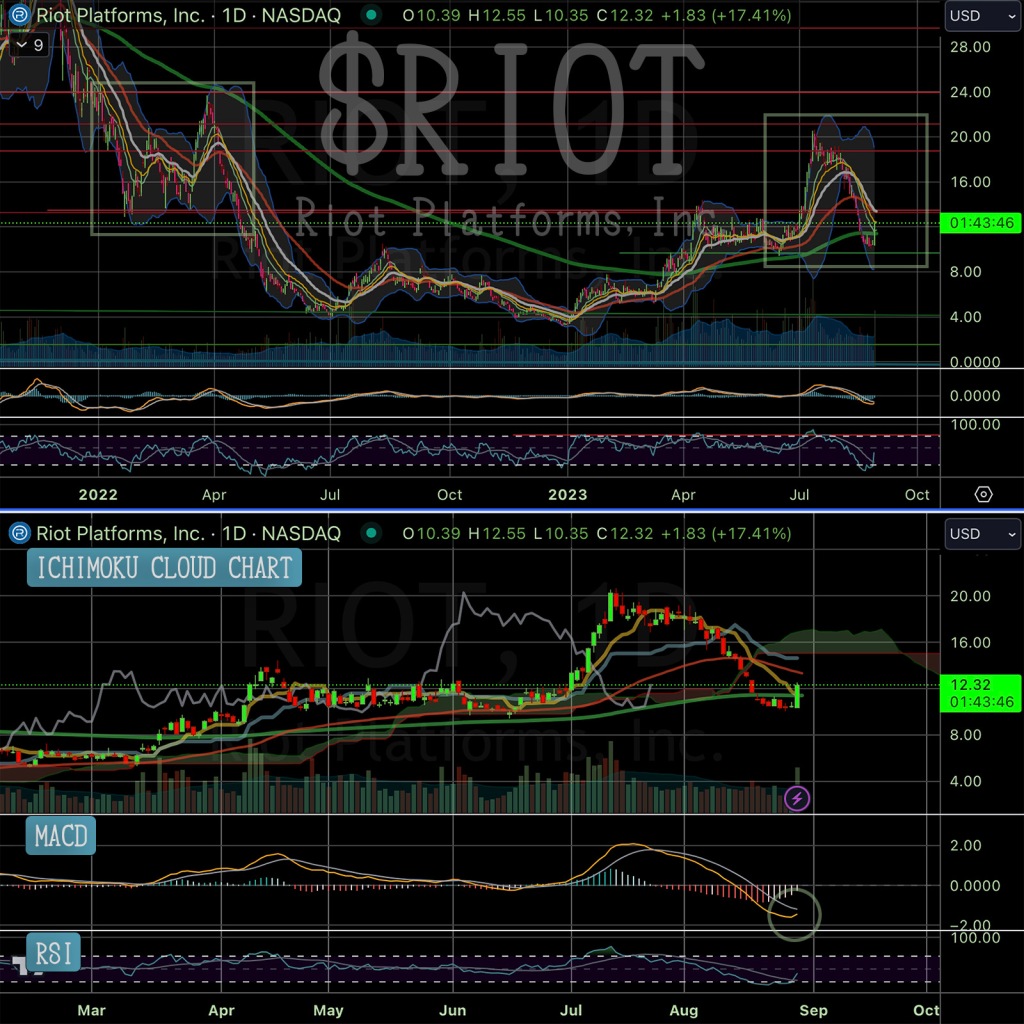
In response to today’s remarkable surge in Bitcoin’s price, RIOT demonstrated a parallel significant jump. This occurrence underscores the substantial influence that Bitcoin’s movements can exert on RIOT’s performance, primarily due to its integral role within the cryptocurrency realm.
● Cup and Handle Formation
RIOT’s stock chart is currently displaying a fascinating technical pattern known as the cup and handle formation. This pattern suggests a bullish continuation, characterized by temporary consolidation (the handle) following a substantial price rise (the cup). In early January, RIOT hit the bottom of the cup, indicating a potential upward movement in its stock price.
● Key EMA Support/Resistance
Technical analysis often involves the use of Exponential Moving Averages (EMAs) to identify critical support and resistance levels. For RIOT, the 25-day EMA is a pivotal support and resistance level. The gray line on the chart represents this EMA, and it plays a significant role in determining the stock’s potential direction.
● MACD Indicator Signal
The Moving Average Convergence Divergence (MACD) indicator is a popular tool among technical analysts. It has caught the attention of RIOT traders as the MACD line shows signs of reversing its previous downward trend. The upward curve of the MACD line indicates a potential shift in the stock’s direction. This shift could potentially transition from a bearish to a bullish momentum.
💡 Chart Technical Tips
*Cup and Handle Pattern*
The cup and handle pattern is a classic bullish continuation formation that holds significant relevance in technical analysis. It typically emerges after a notable price surge and signifies a period of consolidation before further upward movement. The pattern is considered complete when the stock price breaks out above the resistance level of the handle. This pattern is a valuable tool for traders, signaling potential bullish trends in stock prices.
🏹 For The Success Of Your Trading
As we embark on this stock analysis journey, having access to reliable and comprehensive tools is crucial for making informed trading decisions. I am using TradingView, a platform that stands out in the realm of stock chart analysis.

This robust online trading platform offers a wide array of features and tools that empower traders and investors to conduct thorough chart analysis. To read my comprehensive review of TradingView, 👇🏽👇🏿check out this article:
“How TradingView Can Change the Game for Traders“
To explore the advantages of TradingView, feel free to access the platform here.
🍵 Conclusion
In wrapping up our exploration of RIOT Platforms, Inc’s stock analysis, let’s recap the significant facets we’ve uncovered.
The profound influence of Bitcoin’s price movements on RIOT’s performance has been distinctly showcased today, highlighting the intrinsic relationship between these two entities within the cryptocurrency sphere. The captivating cup and handle pattern witnessed on RIOT’s chart portrays a tale of potential growth, underscored by the early January touch at the cup’s base, hinting at a promising upward shift.
Furthermore, the pivotal role played by the 25-day EMA as a support and resistance level, alongside the intriguing signal from the MACD indicator indicating a potential trend reversal, underscores the synergy of technical analysis and informed decision-making.
As you embark on your own trading journey, remember that success lies not only in understanding these insights but also in adapting them to align with your personalized trading strategy. Whether you’re an experienced trader or a newcomer to the world of stock analysis, let these insights guide your path, aiding you in making calculated decisions and traversing the exciting landscape of trading.
🌿 FAQs
1. Why is the 25-day EMA important for RIOT’s stock chart analysis?
The 25-day Exponential Moving Average (EMA) acts as a key support and resistance level for RIOT. It helps traders identify potential trend reversals and assess the stock’s overall momentum.
2. What role does the MACD indicator play in RIOT’s analysis?
The Moving Average Convergence Divergence (MACD) indicator provides insights into the stock’s momentum and potential shifts in direction. A change in the MACD trend could indicate a reversal in RIOT’s stock price movement.
3. How can I use trendlines effectively in stock chart analysis?
Trendlines help visualize the stock’s trajectory and potential trend reversals. Draw them by connecting multiple swing highs or swing lows on the chart.
4. Where can I access real-time RIOT stock charts?
For real-time RIOT stock charts, check TradingView, which is what I’m using. It’s the best online trading platform, offering a comprehensive toolkit to traders!
👉 👉 Connect with Me: Instagram and StockTwits ✌️


