In the fast-paced world of stock technical chart analysis and trading tips, staying informed and making the right moves can be the difference between success and missed opportunities. Today, we turn our attention to FingerMotion, Inc. (Ticker: FNGR), an evolving technology company with a core competency in mobile payment and recharge platform solutions in China.
🔔 Today’s Chart Pick
FingerMotion, Inc. (Ticker: FNGR)
Before we delve into the technical details, let’s get acquainted with FingerMotion, Inc. This innovative company has positioned itself as a key player in the Chinese market, offering mobile payment and recharge platform solutions. What sets FNGR apart is its unique access to wholesale rechargeable minutes from China’s largest mobile phone providers, which can be resold to consumers. This competitive advantage has the potential to drive substantial growth in the coming years.
📈 Dive into the Technical Point

👉 Looking For The Best Online Trading Chart Platform? Check What I’m Using (Pro+)
● Strong Rebound from 50dEMA
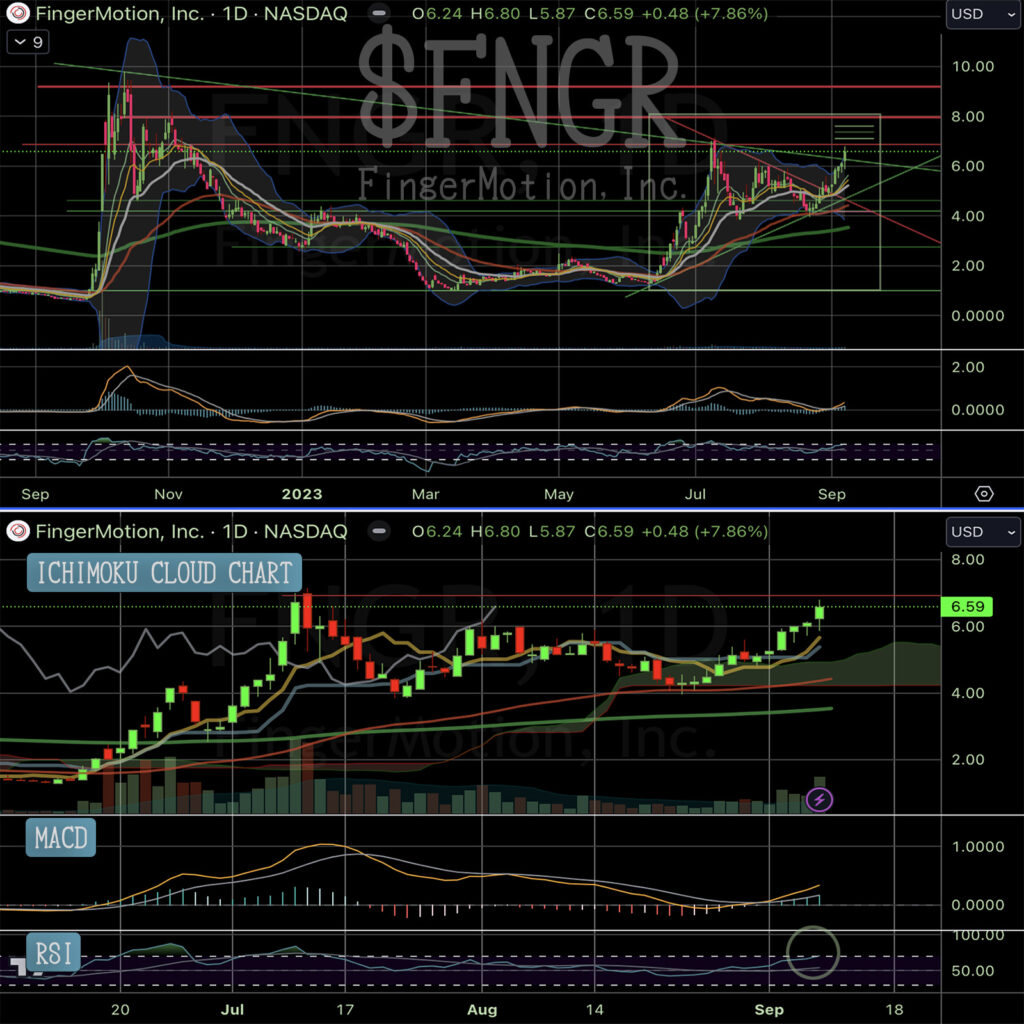
FingerMotion, Inc. (FNGR) recently exhibited a robust recovery, bouncing back from the 50-day Exponential Moving Average (50dEMA). This impressive performance signals inherent strength in the stock, potentially offering a promising outlook for traders and investors alike.
● Breakout from Wedge
In the past week, FNGR made a significant breakthrough as it emerged from a wedge. This pattern is characterized by two converging trendlines, and FNGR’s breakout suggests a potential shift in its prevailing trend towards the upside. Traders should keep a close eye on this development, as it may indicate an opportunity for a bullish trend continuation.
● Caution at Key Resistance
While the EMAs (Exponential Moving Averages) are trending upward, indicating bullish momentum, it’s essential to exercise caution as FNGR approaches a critical resistance level. This level corresponds to the high point on July 12 and resembles a Banzai-style left shoulder formation. Additionally, the Relative Strength Index (RSI) is approaching the overbought zone, suggesting that the stock might be due for a potential pullback.
● Monday Action Could Be a Key
As we look ahead, the upcoming Monday’s trading action could be a determining factor. It will reveal whether FNGR can successfully breach the resistance level to continue its bullish run or face rejection, potentially forming a Banzai-style head and shoulder pattern. Traders should closely monitor this critical juncture to make informed decisions.
💡 Chart Technical Tips
*Wedge Pattern*
The wedge pattern is a technical chart formation characterized by two converging trendlines, either sloping upward (rising wedge) or downward (falling wedge). It often serves as a predictive indicator of potential trend reversals or continuations, depending on the direction of the breakout.
🏹 For The Success Of Your Trading
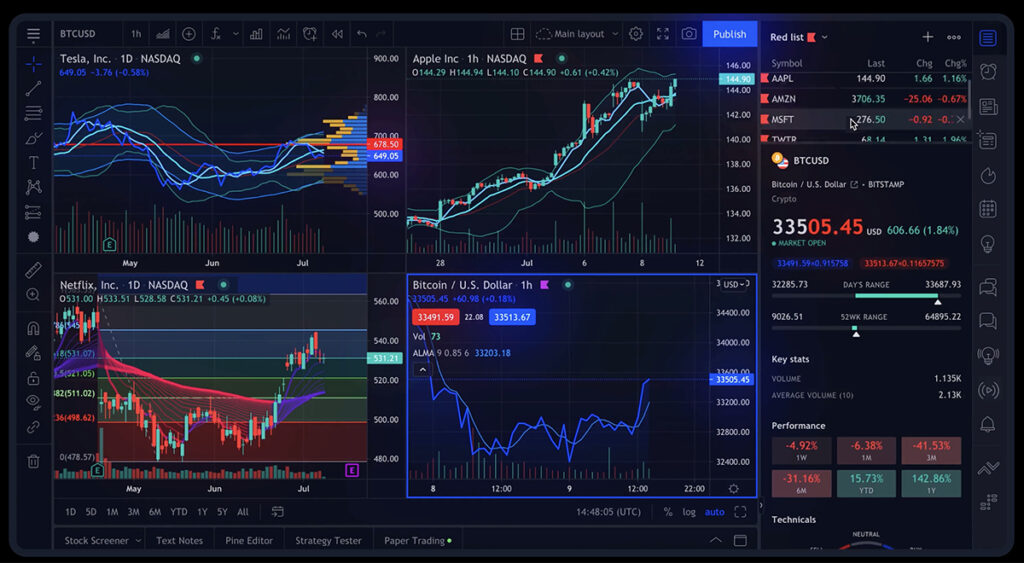
In the realm of stock analysis, having access to reliable and comprehensive tools is crucial for making informed trading decisions. In my daily trading, I use TradingView, a platform that stands out in the realm of stock chart analysis.

This robust online trading platform offers a wide array of features and tools that empower traders and investors to conduct thorough chart analysis. To read my comprehensive review of TradingView, 👇🏽👇🏿check out this article:
“7 Powerful Key Features of the Best Trading Chart Platform: TradingView“
To explore the advantages of TradingView, feel free to access the platform here.
🍵 Conclusion
In conclusion, FingerMotion, Inc. (Ticker: FNGR) presents an intriguing opportunity for traders and investors. Its recent technical performance, including a strong rebound from the 50dEMA and a breakout from the wedge pattern, indicates potential upward momentum. However, caution is advised as the stock approaches a key resistance level, and the RSI nears the overbought zone. The upcoming Monday’s trading action will provide valuable insights into the stock’s future trajectory.
🌿 FAQs
1. What is the significance of the wedge pattern in stock chart analysis?
The wedge pattern is a technical chart formation characterized by two converging trendlines, and it often serves as an indicator of potential trend reversals or continuations, depending on the direction of the breakout.
2. How can traders navigate the potential resistance level in FNGR’s chart analysis?
Traders should exercise caution as FNGR approaches the key resistance level and closely monitor the stock’s performance. The upcoming Monday’s trading action will provide crucial insights into whether the resistance can be breached or if a pullback is imminent.
3. How can I learn more about technical analysis?
To dive deeper into technical analysis, consider enrolling in online courses or reading books on the subject. There are also numerous YouTube channels and forums where traders share their insights.
Additionally, if you’re looking for a comprehensive online trading course, I recommend checking out StockOdds. They offer a range of educational resources and insights that can help you sharpen your technical analysis skills.
4. Where can I access real-time stock charts?
For real-time stock charts, check out TradingView, which is what I’m using. It’s the best online trading platform, offering a comprehensive toolkit to traders!
👉👉 Connect with Me: Instagram and StockTwits ✌️


