In the world of stock technical analysis, every day presents fresh opportunities and challenges for traders and investors alike. Today, we’ll delve into the fascinating realm of Palantir Technologies, Inc. (PLTR), a company that stands at the intersection of data and technology. Let’s explore the technical aspects of PLTR’s stock chart to uncover valuable insights.
Table of Contents
🔔 Today’s Stock Pick
Palantir Technologies, Inc. (Ticker: PLTR)
Palantir Technologies, Inc. is a software company renowned for developing cutting-edge data fusion platforms. Their product arsenal includes Palantir Gotham, Plantir Apollo, and Palantir Foundry, each catering to different aspects of data analysis.
Palantir Gotham seamlessly integrates, manages, secures, and analyzes enterprise data, while Plantir Apollo powers the company’s SaaS platforms. The Palantir Foundry empowers users to create various tables, applications, reports, and presentations, making data analysis accessible to a wide range of industries, including automotive, cyber, finance, law enforcement, and more. With operations spanning North America, Europe, Asia, and the Middle East, Palantir is headquartered in Palo Alto, California, USA.
📈 Dive into Stock Technical Analysis

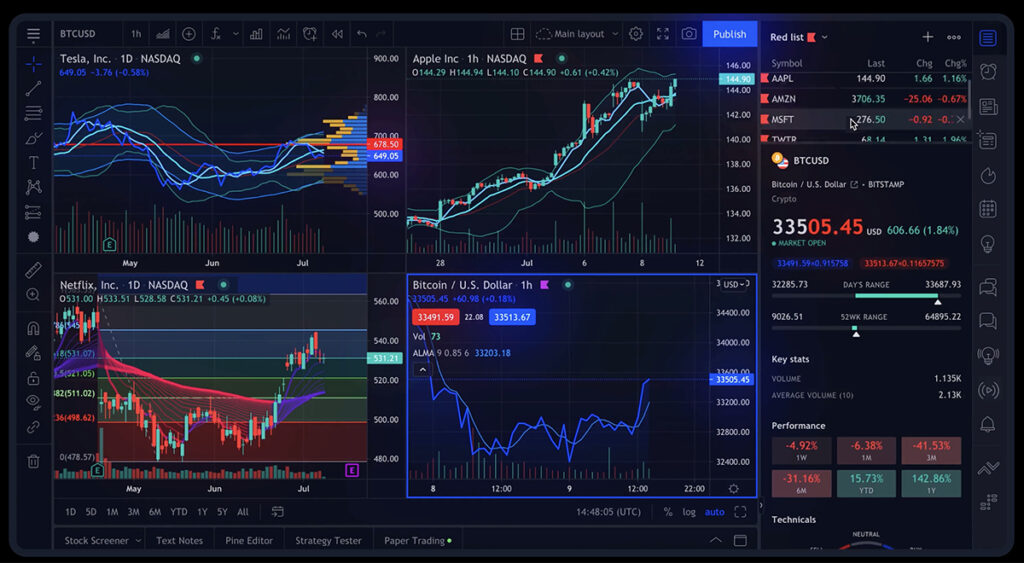
👉 Looking For The Best Online Trading Chart Platform? Check What I’m Using (Pro+)
● Trend Line Support:
Currently, Palantir Technologies, Inc. (PLTR) is finding solid support along a trend line. This trend line can be a crucial indicator of the stock’s direction and momentum.
● Breakout from 25dEMA:
In recent developments, PLTR managed to break above its 25-day Exponential Moving Average (25dEMA), which had been acting as a formidable resistance. This breakout suggests a potential shift in momentum, and the stock is now resting on this level.
● Notable Resistance Levels:
Despite the positive moves, PLTR faces significant resistance ahead. It’s currently testing the KUMO, a component of the Ichimoku Cloud, and the upper Bollinger Band. These are formidable barriers that could significantly influence the stock’s next move.
● Wedge Formation:
The price action of PLTR is forming a tight wedge pattern, indicating potential market indecision. Observing this closely will be crucial, as it may signal an impending breakout. However, the direction of the breakout remains uncertain. If the stock breaks downward, caution is advised, as it could potentially form a head and shoulders pattern.
💡 Chart Technical Tips
*Trend Line*
Trend lines are fundamental tools in technical chart analysis. They represent the direction and momentum of a security’s price movement. In an uptrend, trend lines are drawn by connecting a series of lows, while in a downtrend, they connect a series of highs. Trend lines serve as crucial support and resistance levels, aiding traders in identifying potential entry and exit points.
🏹 For The Success Of Your Trading
In the realm of stock analysis, having access to reliable and comprehensive tools is crucial for making informed trading decisions. In my daily trading, I use TradingView, a platform that stands out in the realm of stock chart analysis.

This robust online trading platform offers a wide array of features and tools that empower traders and investors to conduct thorough chart analysis. To read my comprehensive review of TradingView, 👇🏽👇🏿check out this article:
“7 Powerful Key Features of the Best Trading Chart Platform: TradingView“
To explore the advantages of TradingView, feel free to access the platform here.
🍵 Conclusion
In conclusion, Palantir Technologies, Inc. (PLTR) presents an intriguing opportunity for investors and traders. Understanding the technical aspects of its stock chart through stock technical analysis is vital in making informed decisions. The trend line support and the breakout from the 25-day EMA indicate potential shifts in momentum, while the notable resistance levels and the wedge formation add complexity to the picture.
As you navigate the exciting world of stock technical analysis, remember that success requires diligence, patience, and the right tools. By mastering the art of technical analysis, you can unlock the hidden potential of stocks like PLTR and make well-informed trading decisions to achieve your financial goals.
🌿 FAQs
1.What is the significance of trend lines in stock technical analysis?
Trend lines help identify the direction and momentum of a stock’s price movement and serve as crucial support and resistance levels for traders.
2.Why is the breakout from the 25-day EMA important for PLTR in stock technical analysis?
The breakout from the 25-day Exponential Moving Average (EMA) indicates a potential shift in momentum, which can influence the stock’s future direction.
3.What should traders watch out for in the wedge formation of PLTR’s stock chart during stock technical analysis?
Traders should closely monitor the wedge formation as it may indicate market indecision and signal an impending breakout, but the direction of the breakout remains uncertain.
4. How can I learn more about technical analysis?
To dive deeper into technical analysis, consider enrolling in online courses or reading books on the subject. There are also numerous YouTube channels and forums where traders share their insights.
Additionally, if you’re looking for a comprehensive online trading course, I recommend checking out StockOdds. They offer a range of educational resources and insights that can help you sharpen your technical analysis skills.
5. Where can I access real-time stock charts?
For real-time stock charts, check out TradingView, which is what I’m using. It’s the best online trading platform, offering a comprehensive toolkit to traders!
👉👉 Connect with Me: Instagram and StockTwits ✌️


