Hi there, fellow traders and investors! Are you ready to dive into the exciting world of stock chart analysis? In the fast-paced world of finance, staying ahead of the curve is essential. Today, we present you with a unique chart analysis that’s creating waves in the market – Bitcoin / USD (BTCUSD). Embark on a journey into the dynamic world of stock chart analysis. As the cryptocurrency industry continues to evolve, mastering the art of interpreting Bitcoin charts could be your gateway to financial success.
🔔 Today’s Chart Pick
Bitcoin / USD (BTCUSD)
In today’s rapidly changing financial landscape, Bitcoin stands as a symbol of innovation and potential. This digital currency has taken the world by storm, captivating the imagination of investors, traders, and tech enthusiasts alike. But what sets today’s BTCUSD analysis apart? We’ll unravel the latest trends, technicalities, and insights that will empower you to make informed decisions in the world of Bitcoin trading.
📈 Dive into the Technical Point

👉 Looking For The Best Online Trading Chart Platform? Check What I’m Using (Pro+)
● Support Breakdown and Encountering Resistance
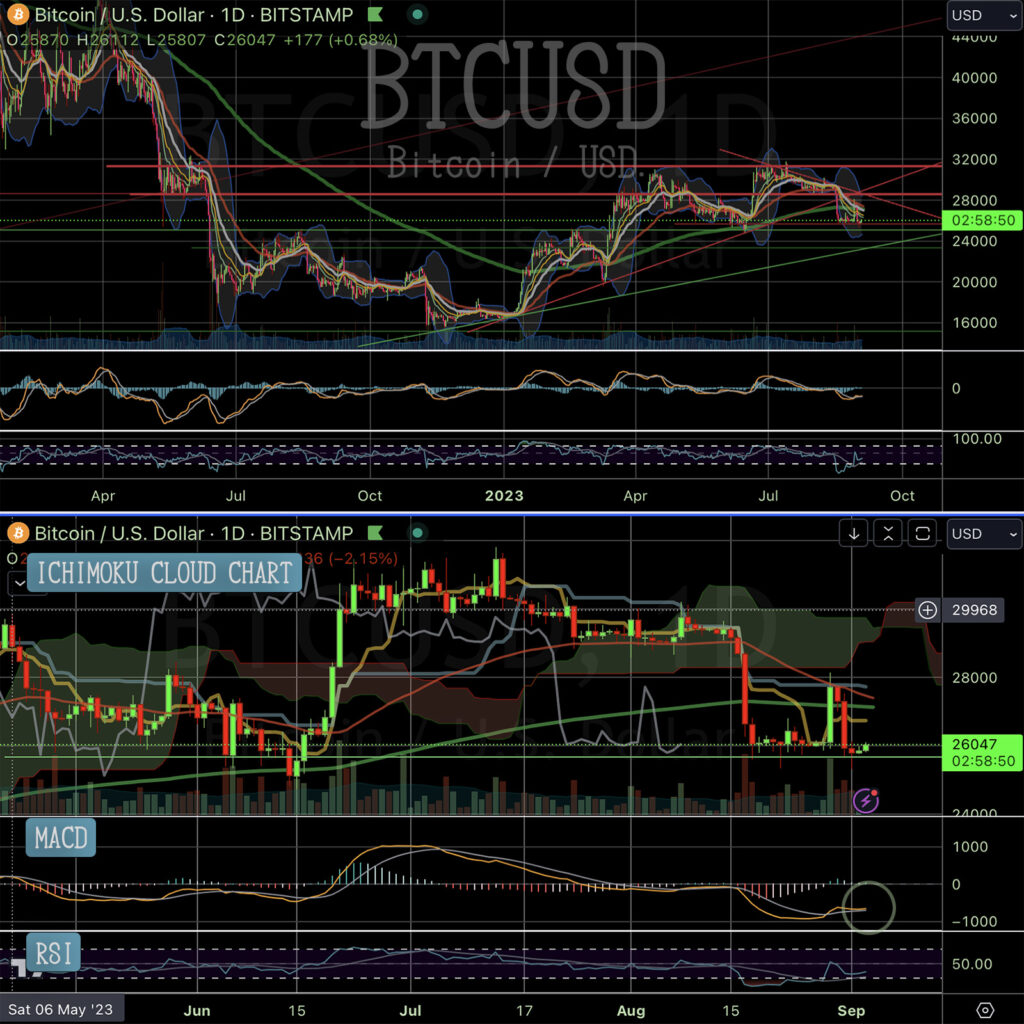
On August 17th, Bitcoin experienced a breakdown of the trend line support. And after this breakdown, Bitcoin found temporary support, stabilizing its price.
After trading along this level for several days, a sudden significant leap occurred last Tuesday. However, it was met with rejection from a formidable resistance zone, comprising the former t-line support and other significant resistance areas, causing it to revert back to the support level.
● Indicators showing some positive signs
Despite the price fluctuations, Bitcoin’s technical indicators are showing some positive signs. Both the Moving Average Convergence Divergence (MACD) and the Relative Strength Index (RSI) are lifting their heads up. This divergence between indicators and price action suggests that Bitcoin may be gearing up for a significant move.
Additionally, Bitcoin still appears to be on track to form a significant “cup” pattern, which is a bullish signal in technical analysis. Keep an eye on this pattern as it could indicate future price growth.
● What to Watch in the Coming Week
Looking ahead to the coming week, there are two key areas to monitor.
First, we’ll be closely watching whether Bitcoin can maintain its current support level. The ability to hold this support and potentially initiate a bounce could be a positive sign for Bitcoin bulls.
Secondly, breaking through the tough resistance zone above its current price remains a crucial challenge. If Bitcoin manages to overcome this resistance, it could open the door to further upward movement.
💡 Chart Technical Tips
*Support/Resistance Transition*
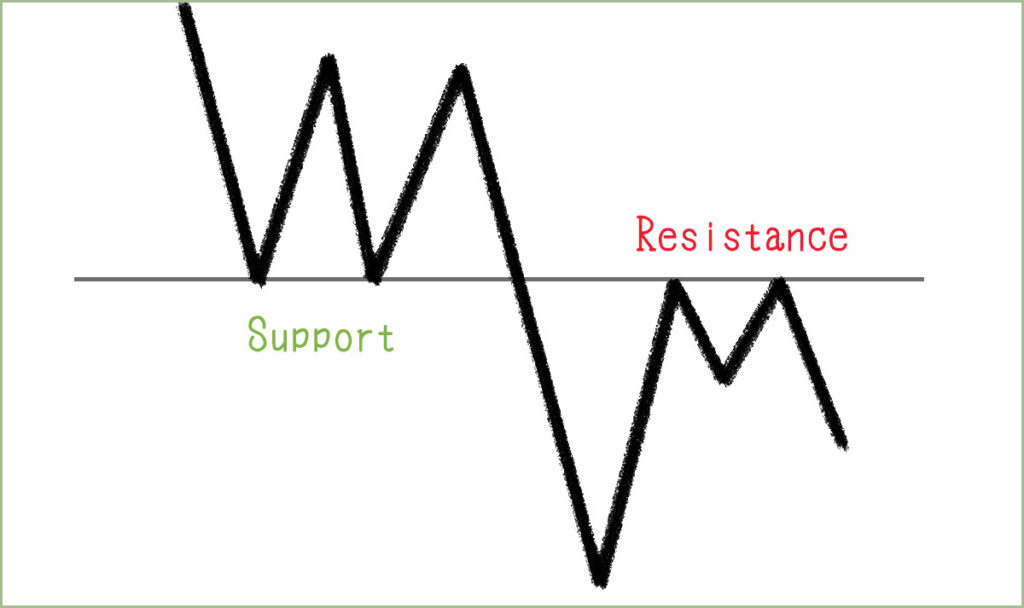
In the world of technical analysis, support and resistance levels are fundamental concepts. When a support level is breached, it often transforms into a resistance level (and vice versa). This transition can signify a shift in market sentiment and influence price movements.

Traders and investors should pay close attention to support/resistance transitions as they can provide valuable insights into potential reversals and changes in market trends. These moments are often pivotal in decision-making, helping traders navigate the cryptocurrency market with more confidence.
🏹 For The Success Of Your Trading
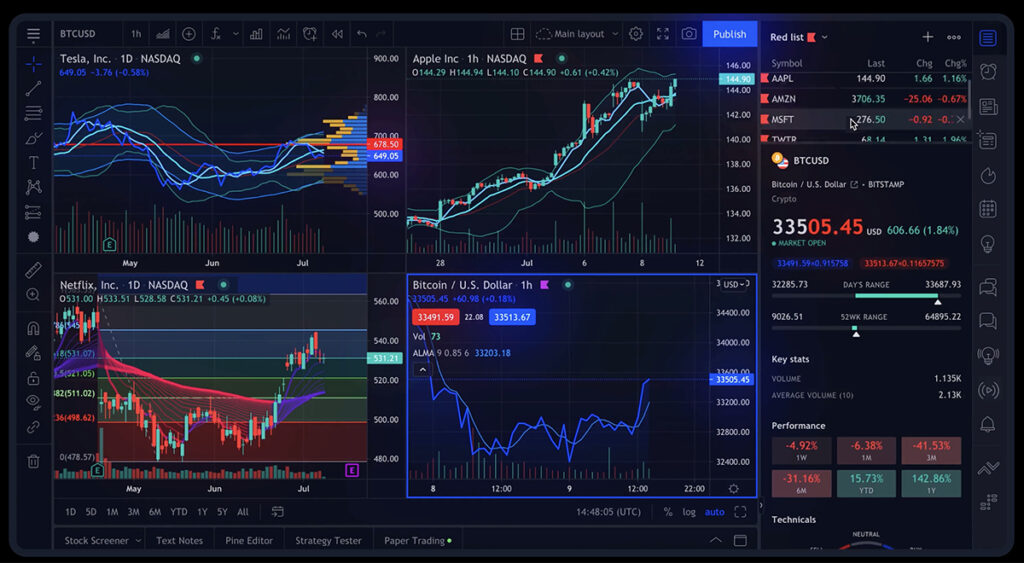
As we venture into the realm of stock analysis, having access to reliable and comprehensive tools is crucial for making informed trading decisions. In my daily trading, I use TradingView, a platform that stands out in the realm of stock chart analysis.

This robust online trading platform offers a wide array of features and tools that empower traders and investors to conduct thorough chart analysis. To read my comprehensive review of TradingView, 👇🏽👇🏿check out this article:
“7 Powerful Key Features of the Best Trading Chart Platform: TradingView“
To explore the advantages of TradingView, feel free to access the platform here.
🍵 Conclusion
In conclusion, Bitcoin’s recent price action and technical indicators suggest that it’s at a critical juncture. The support level and the resistance zone above will be key areas to watch in the coming week.
Whether you’re a seasoned trader or a newcomer to cryptocurrency, understanding these technical points can help you make more informed decisions in the dynamic world of Bitcoin trading.
🌿 FAQs
1. How can I stay updated on Bitcoin’s price movements?
Staying updated on Bitcoin’s price is crucial for traders. I recommend using reputable cryptocurrency news websites and mobile apps that provide real-time price data.
2. What is the significance of support and resistance levels in trading?
Support and resistance levels are critical because they indicate where buying and selling pressures are likely to emerge. They help traders identify potential entry and exit points in the market.
3. How can I learn more about technical analysis?
To dive deeper into technical analysis, consider enrolling in online courses or reading books on the subject. There are also numerous YouTube channels and forums where traders share their insights.
Additionally, if you’re looking for a comprehensive online trading course, I recommend checking out StockOdds. They offer a range of educational resources and insights that can help you sharpen your technical analysis skills.
4. What are the best strategies for trading Bitcoin?
There are various trading strategies for Bitcoin, including day trading, swing trading, and long-term investing. The best strategy depends on your risk tolerance and trading goals.
5. Where can I access real-time Bitcoin stock charts?
For real-time Bitcoin stock charts, check out TradingView, which is what I’m using. It’s the best online trading platform, offering a comprehensive toolkit to traders!
👉 👉 Connect with Me: Instagram and StockTwits ✌️


