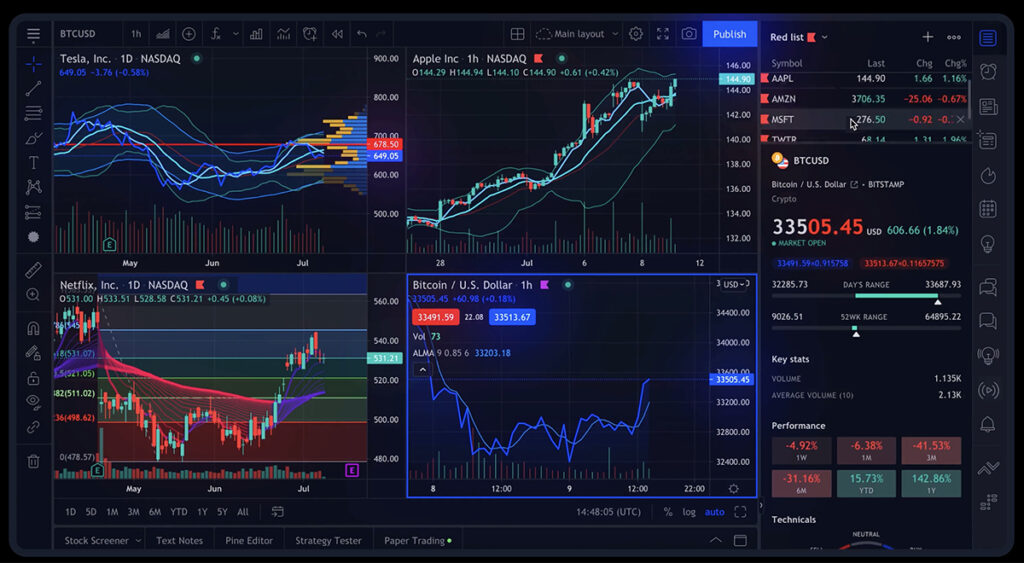
Hi there, fellow traders and investors! Today, in this article, I’ll be sharing my chart analysis about the recent movements of Amazon.com, Inc (Ticker: AMZN). Whether you’re a seasoned pro or just getting started, understanding how to read stock charts and spot potential trends can give you a real edge. So, let’s jump right in and take a closer look at AMZN.
🔔 Today’s Stock Pick
Amazon.com, Inc (Ticker: AMZN)
So, what’s caught my eye today? It’s Amazon.com, Inc, represented by the ticker symbol AMZN.
Before we dive into the nitty-gritty details, let’s take a moment to understand the recent developments in Amazon’s market performance. The e-commerce and technology giant has been a key player in shaping consumer behavior and online retail trends. With its diverse range of services and products, Amazon’s stock performance often reflects broader shifts in the market sentiment.
📈 Dive into the Technical Point

👉 Looking For The Best Online Trading Chart Platform? Check What I’m Using (Pro+)
● Key Resistance Challenge: A Bump in the Road
Amazon, after experiencing a sustained upward movement, made a notable jump on August 4th to breach a significant resistance level. The anticipation was high, but unfortunately, the attempt was met with rejection, leading to a subsequent decline in price. This situation emphasizes the significance of recognizing and strategizing around key resistance levels.
● 50-day Exponential Moving Average (EMA) Test
Presently, Amazon is undergoing a pivotal test – the evaluation of its 50-day Exponential Moving Average (EMA). This technical indicator holds substantial importance, often acting as a strong support level during periods of price action. Observing how Amazon responds to this test can provide valuable insights into its short-term trend direction.
● Navigating the W Top Formation and Support
An interesting chart pattern has started to emerge in Amazon’s stock chart – the W top formation. This pattern could potentially signal a reversal in the current trend. However, the situation is not that straightforward. Despite the W top formation, Amazon is finding substantial support from both the 50-day EMA and the KUMO (ichimoku cloud). This confluence of support and resistance levels adds complexity to the scenario and highlights the need for careful analysis.
● Critical Juncture: Make or Break
We stand at a crucial juncture in Amazon’s price movement. The decisions made here could potentially pave the way for the stock’s future trajectory. There are two scenarios at play: a potential rebound, backed by the discussed technical indicators, or the risk of a breakdown. In case of a breakdown, the 200-day EMA might emerge as a crucial support level.
💡 Chart Technical Tips
*Ichimoku Cloud*
One of the technical tools that traders often rely on is the Ichimoku Cloud, also known as the Ichimoku Kinko Hyo. This comprehensive tool offers insights into potential support and resistance levels, trend direction, and momentum. The KUMO, or cloud component, acts as an area of interest for potential support or resistance. The Ichimoku Cloud helps traders identify trends and potential breakout or breakdown points, contributing to informed trading decisions.
🏹 For The Success Of Your Trading
As we embark on this stock analysis journey, having access to reliable and comprehensive tools is crucial for making informed trading decisions. I am using TradingView, a platform that stands out in the realm of stock chart analysis.

This robust online trading platform offers a wide array of features and tools that empower traders and investors to conduct thorough chart analysis. To read my comprehensive review of TradingView, 👇🏽👇🏿check out this article:
“How TradingView Can Change the Game for Traders“
To explore the advantages of TradingView, feel free to access the platform here.
🍵 Conclusion
In this analysis, we’ve delved deep into the captivating world of stock chart reading by focusing on Amazon.com, Inc (Ticker: AMZN). We explored recent price movements, identified key resistance challenges, examined the importance of the 50-day EMA, and deciphered the intriguing W top formation. Additionally, we recognized the pivotal crossroads Amazon finds itself in and the resulting possibilities. Remember, while technical analysis provides valuable insights, it’s essential to complement it with comprehensive research and prudent decision-making.
🌿 FAQs
1. What is the significance of the W top formation?
The W top formation can suggest a potential trend reversal. However, it’s essential to consider other indicators and factors before drawing conclusions.
2. How can I use the Ichimoku Cloud in my trading strategy?
The Ichimoku Cloud helps you identify support and resistance levels, trends, and momentum. Integrate it with other indicators for a comprehensive approach.
3. What does testing the 50-day EMA mean for a stock?
Testing the 50-day EMA is significant as it indicates a stock’s short-term trend. A successful bounce off this level might signal continued upward momentum.
4. How often should I check for resistance levels?
Regularly monitor resistance levels, especially during times of heightened market activity or significant news events.
5. Where can I access real-time AMZN stock charts?
For real-time AMZN stock charts, check TradingView, which is what I’m using. It’s the best online trading platform, offering a comprehensive toolkit to traders!
👉 👉 Connect with Me: Instagram and StockTwits ✌️


