In the realm of daily chart analysis and stock chart reading, every trading day presents a new opportunity to uncover valuable insights and strategic moves. Today, we shift our focus to Blue Apron Holdings, Inc (APRN), a captivating contender in the stock market landscape. With a discerning eye, we’ll delve into the intricate details of APRN’s stock chart, exploring patterns, indicators, and trends that can guide us towards informed trading decisions.
🔔 Today’s Stock Pick
Blue Apron Holdings, Inc (Ticker: APRN)
Blue Apron Holdings, Inc is a leading NYC-based company offering meal kit delivery services. Their pre-portioned ingredients and recipes empower users to create restaurant-quality meals at home, redefining convenience and culinary exploration.
📈 Dive into the Technical Point

👉 Looking For The Best Online Trading Chart Platform? Check What I’m Using (Pro+)
● Potential Cup Formation Emerging
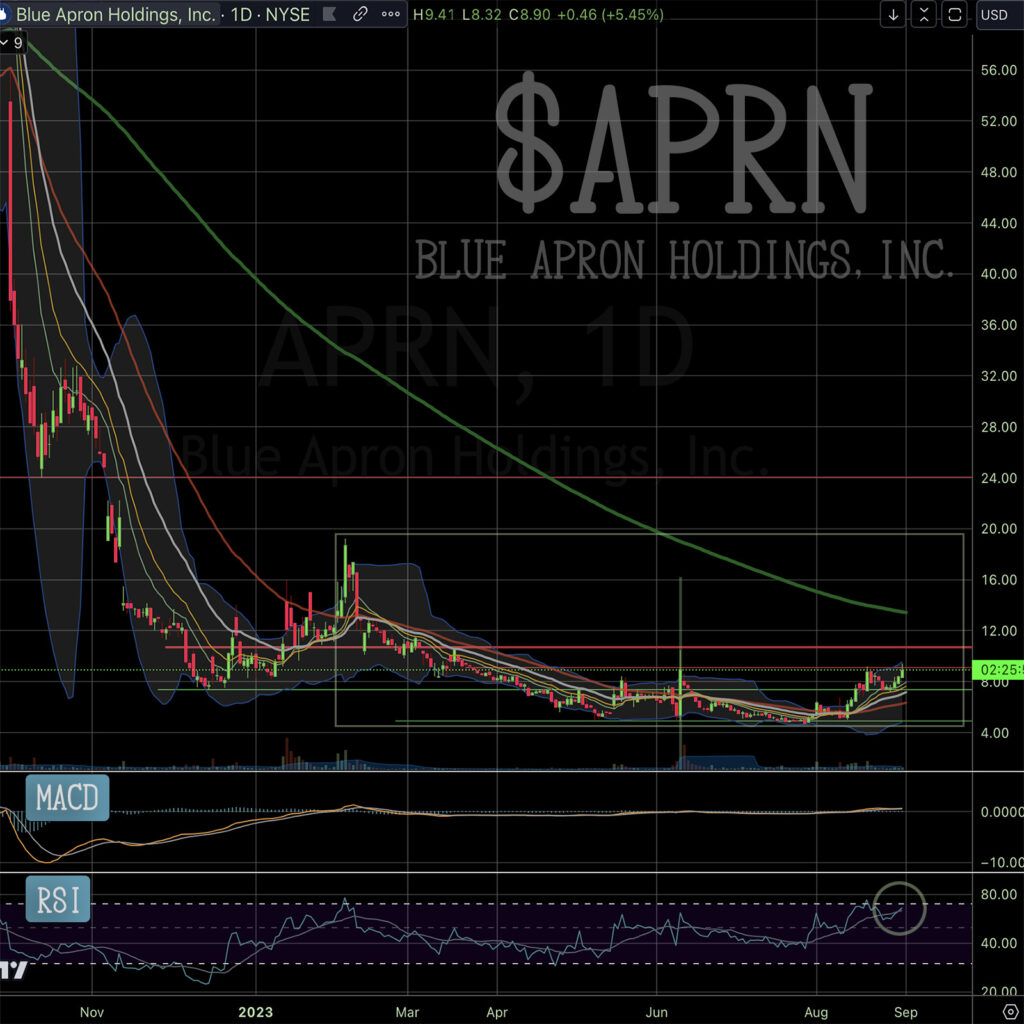
After hitting the bottom in July, APRN is showing promising signs of an upward movement. Currently, the stock is forming what seems to be a potential cup pattern. This pattern indicates a potential bullish trend, which traders should monitor closely.
● Testing Resistance After Bounce
Following a rebound from a support level, the stock enjoyed a positive three-day run. However, it’s now encountering a resistance level. Although this resistance may not be formidable, it’s crucial to observe how the stock handles it as it strives to continue its ascent.
● RSI is Getting Overbought Signal
The Relative Strength Index (RSI) is giving us an important signal by entering the overbought zone. This suggests that the stock might experience adjustment pullbacks or accumulation phases before resuming its upward trajectory. Traders should be aware of these potential shifts in momentum.
💡 Chart Technical Tips
*RSI (Relative Strength Index)*
The Relative Strength Index (RSI) is a widely used technical indicator that gauges the magnitude and speed of price movements. With values ranging from 0 to 100, the RSI provides insights into the stock’s overbought and oversold conditions. An RSI value above 70 can indicate that the stock is overbought, possibly leading to a price correction. Conversely, an RSI value below 30 suggests oversold conditions, indicating a potential price rebound. Traders and analysts often rely on RSI readings to identify trends and potential reversals.
🏹 For The Success Of Your Trading
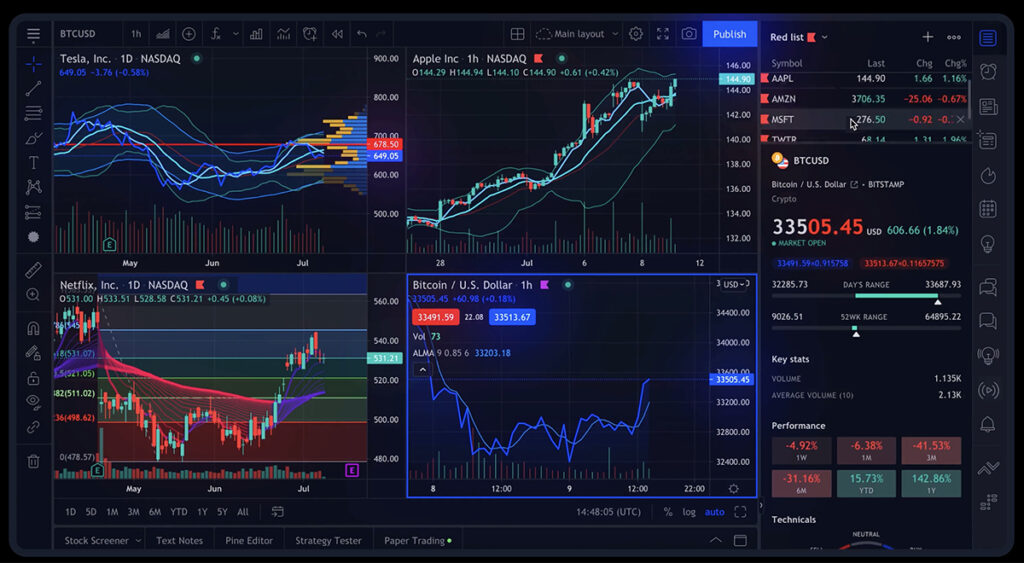
As we venture into the realm of stock analysis, having access to reliable and comprehensive tools is crucial for making informed trading decisions. In my daily trading, I use TradingView, a platform that stands out in the realm of stock chart analysis.

This robust online trading platform offers a wide array of features and tools that empower traders and investors to conduct thorough chart analysis. To read my comprehensive review of TradingView, 👇🏽👇🏿check out this article:
“How TradingView Can Change the Game for Traders“
To explore the advantages of TradingView, feel free to access the platform here.
🍵 Conclusion
In this analysis of Blue Apron Holdings, Inc (APRN), we’ve explored its recent price movements, technical indicators, and potential trends. The stock’s cup formation and interactions with resistance levels highlight its current trajectory. By understanding the nuances of technical analysis, traders can make more informed decisions in a volatile market.
🌿 FAQs
1. What is the significance of a cup pattern in stock analysis?
A cup pattern indicates a potential bullish trend, where the stock’s price initially dips, forms a rounded bottom (the cup), and then starts to rise. It’s a pattern that suggests a possible upward movement in the stock’s price.
2. How should traders interpret the RSI entering the overbought zone?
When the RSI enters the overbought zone (above 70), it implies that the stock might be overvalued and due for a correction. Traders should be cautious and consider potential pullbacks or consolidation.
3. Where can I access real-time APRN stock charts?
For real-time APRN stock charts, check TradingView, which is what I’m using. It’s the best online trading platform, offering a comprehensive toolkit to traders!
👉 👉 Connect with Me: Instagram and StockTwits ✌️


