Embark on a journey through the captivating world of candlestick patterns and charts, where every flicker of the candle reveals a tale of market dynamics.
For traders seeking precision in market navigation, mastering the intricacies of candlestick charts is not just a step. It’s a pivotal move toward smarter, more strategic trading.

In this article, we explore the fundamentals of how to read candlestick patterns and candlestick charts, which serve as your guide to understanding and anticipating price movements.
Join us as we illuminate the path to informed and strategic trading!
✏️ Table of Contents
🌐 Unlocking the Basics of Candlestick Charts
❓ What is a Candlestick Chart?

A candlestick chart is a visual representation of price movements in financial markets, with its origins attributed to Munehisa Honma, an 18th-century Japanese rice futures trader.
Honma, recognized as the pioneer of candlestick charting, understood the profound impact of human emotions on market dynamics. In his quest for a strategic advantage, he devised a charting system, laying the foundation for what we now know as candlestick charts.
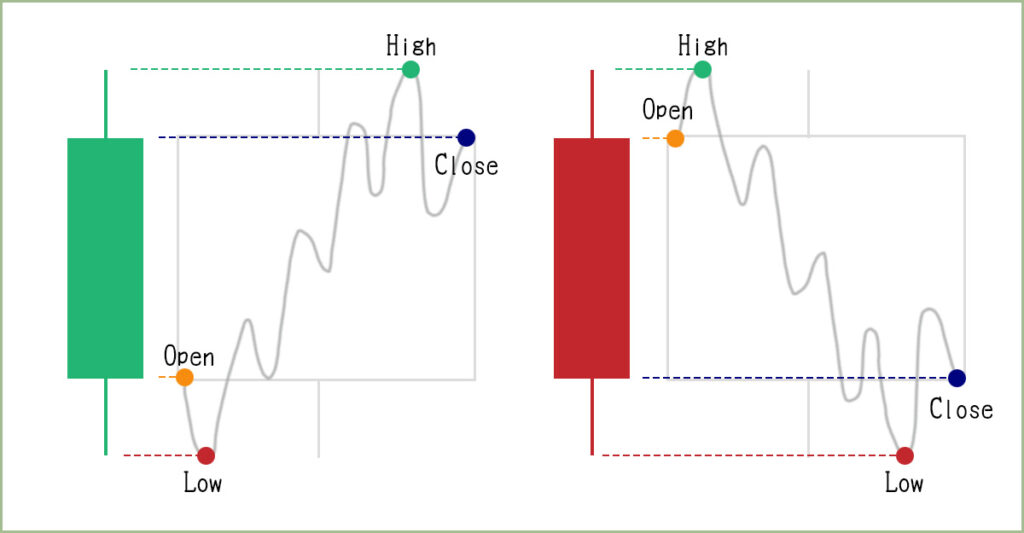
Each candlestick typically corresponds to a specific time frame, presenting the opening, closing, high, and low prices. These charts offer a comprehensive view of market sentiment, making them indispensable tools for technical analysis.

🕯️ The Anatomy of a Candlestick
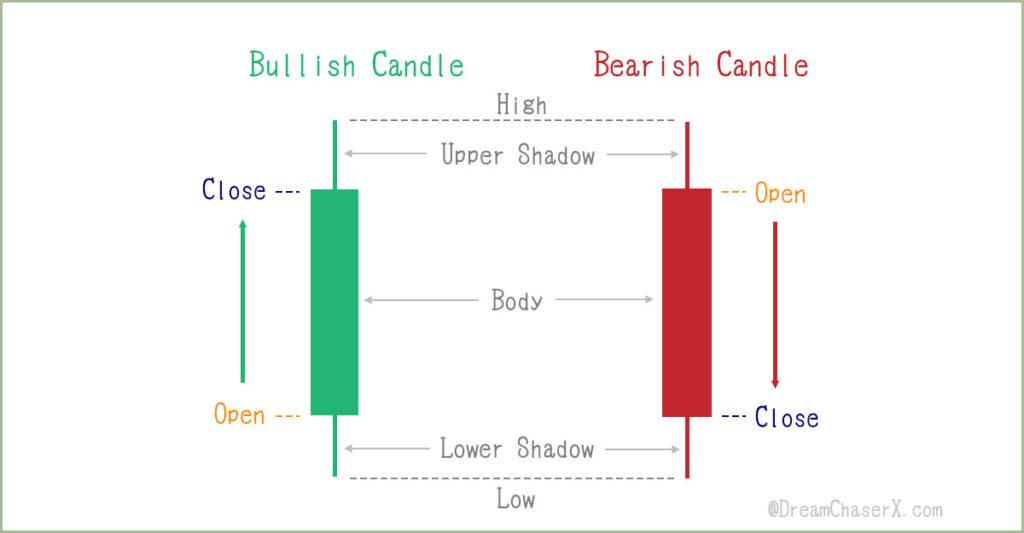
A single candlestick comprises a rectangular body and two shadows (or wicks) extending from the top and bottom.
- The body represents the opening and closing prices.
- The wick (or shadow) indicates the intra-day high and low.
- The color signifies whether the price moved up or down during the specified time period.
🟢 Green (or white) candles indicate a bullish movement, suggesting that the closing price is higher than the opening price.
🔴 Red (or black) candles represent bearish movements, indicating a closing price lower than the opening price.

Over the course of time, individual candlesticks create patterns that traders can leverage to identify significant support and resistance levels.
Within the market, numerous candlestick patterns signal opportunities—some shedding light on the interplay between buying and selling pressures, while others pinpoint continuation patterns or instances of market indecision.
Prior to embarking on your trading journey, it’s crucial to acquaint yourself with the fundamentals of candlestick patterns and understand how they can guide your decision-making process.
✏️ How to Read Candlestick Patterns
Understanding candlestick patterns involves recognizing the signals they convey. A single candlestick can tell a story about market sentiment, and combining multiple candlesticks can unveil powerful insights into trends and potential reversals.

Some key points to look for in interpreting candlestick patterns:
📌 Length of Bodies
Generally, longer bodies indicate heightened buying or selling pressure, while shorter candlesticks signal minimal price movement, suggesting a period of consolidation.
☝️ Potential turning points:
Long-bodied bullish or bearish candles can act as potential turning points. After prolonged declines, a long bullish candlestick may signal a turning point or support level. Conversely, after an extended advance, a long bearish candlestick can foreshadow a turning point or indicate a future resistance level.
📌 Upper and Lower Shadows
Upper shadows highlight the session’s high, while lower shadows reveal the session’s low. Short shadows suggest concentrated trading near the open and close, whereas long shadows indicate prices extending well beyond these points.
☝️ Deciphering pressure;
Candlesticks with a long upper shadow and short lower shadow point to selling pressure.
Candlesticks with long lower shadows and short upper shadows suggest buying pressure.
🕒 Time Frames in Candlestick Charts
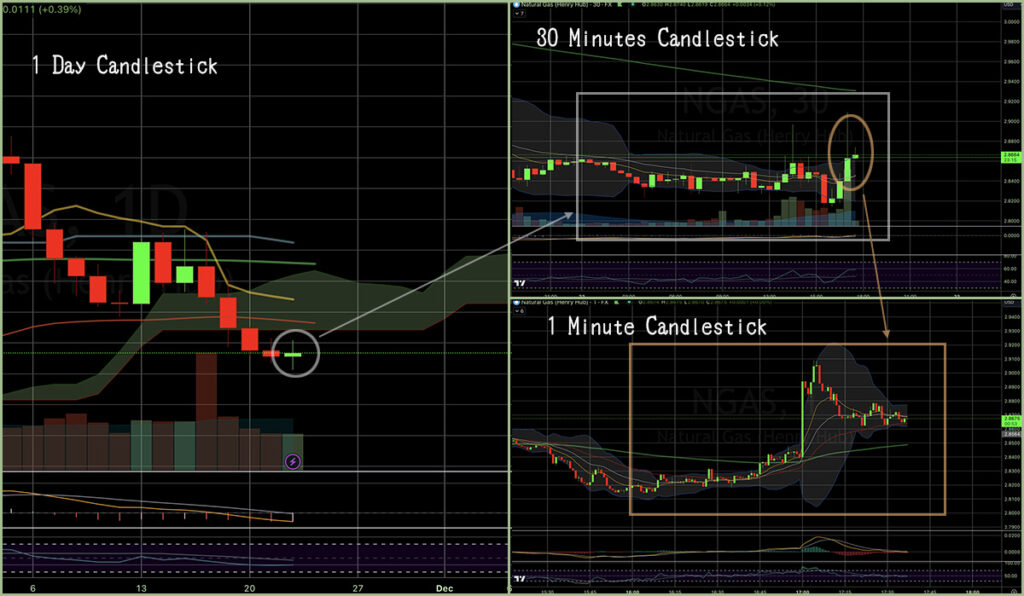
Candlestick charts come in various time frames, offering insights into market dynamics over different periods.

📈 Longer-Term Chart (Daily, Weekly Candlesticks)
A 1-year time frame chart has daily candlesticks, while a 5-year time frame chart has weekly candlesticks.
These charts provide a broader perspective, helping investors identify major trends and potential turning points over extended periods.
📈 Intraday Charts (1 Minute, 5 Minutes, 30 minutes candlesticks etc.)
A 1-day time frame chart has 1-minute candlesticks, and a 1-month time frame chart has 30-minute candlesticks.
These intraday charts offer a more detailed view of price movements throughout the trading day, aiding in the identification of short-term trends and entry/exit points.
☕ Choosing the Right Time Frame
The choice of time frame in candlestick charts is a strategic decision that aligns with a trader’s goals and preferred style. Whether focusing on the big picture or honing in on short-term fluctuations, understanding the nuances of different time frames is an essential aspect of successful trading.

🌱 Long-Term Investors
Those looking to capitalize on overarching market trends and make decisions based on a broader economic outlook often favor daily (1 year chart), weekly (5 years chart), or even longer time frame chart.
🍃 Swing Traders and Day Traders
For those engaged in shorter-term trading, seeking to capture short to medium-term price swings, or focused on making rapid decisions within a single trading session, intraday charts with 1-minute or 5-minute candlesticks become invaluable.
However, while a trader may have a preferred time frame, it’s also essential to keep an eye on multiple charts. This practice allows for a comprehensive understanding of the market context.
For instance, a day trader using a 5-minute chart may benefit from glancing at the 1-hour chart to identify overarching trends.Examining shorter time frame candles provides a more detailed analysis of price movements. This granularity can be particularly advantageous for spotting intraday patterns, assessing volatility, and making precise entry and exit decisions.

🌐 Integrating Candlestick Charts into Your Trading Strategy
Candlestick patterns and charts are invaluable for identifying trends, whether bullish, bearish, or ranging. Recognizing trends provides essential information for traders to make informed decisions about entering or exiting positions, incorporating the identification of key candlestick patterns to establish strategic entry points and opportune exit points.
🔔 Common Single Candlestick Patterns
▪️Big Bullish Candlestick / Big Bearish Candlestick

A big bullish candlestick signals a strong upward price movement, with the closing price significantly higher than the opening. Conversely, a big bearish candlestick indicates a substantial downward movement, where the closing price is well below the opening.
▪️Spinning Top

A spinning top is characterized by a small body with upper and lower shadows of similar length. It suggests indecision in the market, with neither buyers nor sellers dominating. It often appears during periods of consolidation or market uncertainty.
▪️Marubozu

A Marubozu is a candlestick with no shadows, meaning the opening price is the same as the low (for a bullish Marubozu) or the closing price is the same as the high (for a bearish Marubozu). It signifies strong momentum in the direction of the candle.
▪️Hammer

A hammer is a bullish reversal pattern with a small body near the high and a long lower shadow. It suggests that sellers pushed the price significantly lower during the session, but buyers managed to bring it back up, indicating potential bullish reversal.
▪️Inverted Hammer

Similar to a hammer, the inverted hammer is a bullish reversal pattern with a small body near the low and a long upper shadow. It suggests that sellers were initially in control, pushing the price down, but buyers took charge by the end of the session.
▪️Shooting Star

The shooting star shares a similar shape with the inverted hammer but is formed within an uptrend. It occurs after an uptrend, indicating potential exhaustion among buyers. The presence of a long upper shadow signals that, despite an initial attempt to drive prices higher, sellers took control, ultimately pushing the price back down by the end of the period.
▪️Hanging Man

The hanging man is a bearish reversal pattern with a small body near the high and a long lower shadow. It appears after an uptrend and suggests potential bearish reversal, as buyers couldn’t maintain control, allowing sellers to bring the price down.
▪️Doji

A Doji has a small body, indicating that the opening and closing prices are nearly the same. It signals market indecision and potential reversal. The length of the shadows can provide insights into the battle between buyers and sellers.
▪️Dragonfly Doji

A Dragonfly Doji is a bullish reversal pattern with a small body near the low and a long upper shadow. It suggests that sellers pushed the price down during the session, but buyers regained control, indicating potential bullish reversal.
▪️Gravestone Doji

The Gravestone Doji is a bearish reversal pattern with a small body near the high and a long lower shadow. It appears after an uptrend and suggests potential bearish reversal, as buyers lost control, allowing sellers to bring the price down.
🔔 Common Combined Candlestick Patterns
🔥 Bullish Candlestick patterns
🟢 Bullish Engulfing ► Potential reversal

This pattern consists of a small bearish candle followed by a larger bullish candle that completely engulfs the previous one. It signals a potential reversal from a downtrend to an uptrend.
🟢 Piercing Line ► Potential reversal

This pattern occurs after a downtrend and consists of a bearish candle followed by a bullish candle that closes above the midpoint of the previous candle. It signals a potential reversal.
🟢 The Morning Star ► Potential bullish reversal

The Morning Star is a three-candle pattern that forms at the end of a downtrend. It starts with a bearish candle, followed by a small-bodied candle (can be bullish or bearish), and ends with a bullish candle. It suggests a potential bullish reversal.
🟢 Three White Soldiers ► Strong upward reversal

This pattern consists of three consecutive long bullish candles, signaling a strong upward reversal. It typically occurs after a downtrend.
🟢 Tweezer Bottoms ► Potential bullish reversal

Tweezer Bottoms form when two or more candlesticks have matching or nearly matching bottoms, indicating potential support. It suggests a potential bullish reversal.
🟢 Bullish Harami ► Potential bullish reversal

This pattern involves a small bearish candle (the mother) followed by a smaller bullish candle (the baby) that is entirely within the range of the mother candle. It suggests a potential bullish reversal.
💧 Bearish Candlestick patterns
🔴 Bearish Engulfing ► Potential reversal from an uptrend to a downtrend

Similar to the Bullish Engulfing but in the opposite direction. It starts with a small bullish candle followed by a larger bearish candle that engulfs the previous one, signaling a potential reversal from an uptrend to a downtrend.
🔴 Dark Cloud Cover ► Potential bearish reversal

This pattern occurs after an uptrend and consists of a bullish candle followed by a bearish candle that closes below the midpoint of the previous candle. It suggests a potential bearish reversal.
🔴 The Evening Star ► Potential bearish reversal

Similar to the Morning Star but signals a potential bearish reversal. It starts with a bullish candle, followed by a small-bodied candle, and ends with a bearish
🔴 The Three Black Crows ► Strong downward reversal

This bearish reversal pattern consists of three consecutive long bearish candles, signaling a strong downward reversal. It typically occurs after an uptrend.
🌐 Mastering Candlestick Patterns: The Art of Interpretation and Practice
Now that we’ve delved into various candlestick patterns, here’s some guidance for mastering this intricate art.
Begin by acquainting yourself with diverse patterns and train your eyes to swiftly recognize these patterns through regular exposure to historical charts.

Then, practice the art of backtesting to assess the effectiveness of your strategy, starting with smaller positions to test your strategy effectively while minimizing potential risks, building confidence and fine-tuning your ability to interpret patterns accurately.
Remember, mastery is a journey, not a destination. Be patient with the learning process and consistently practice your skills to become intuitive and confident in your decision-making.
Mastering candlestick patterns is about applying that knowledge effectively in the ever-changing financial landscape. Consider these words as your guide on this exciting journey.
🏹 For Sharpening Your Trading Skills
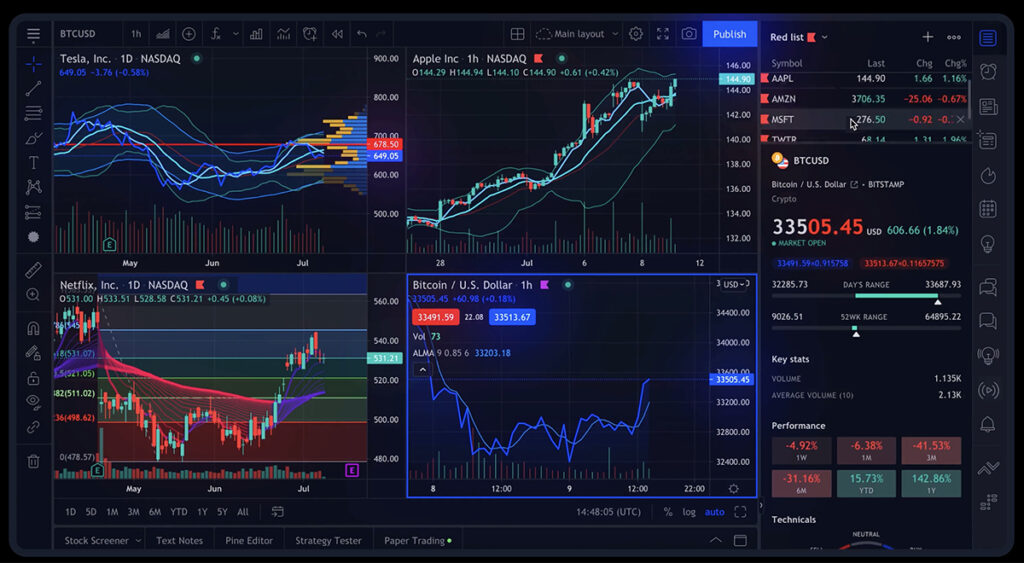
As we delve deeper into the world of stock market technical analysis, having access to reliable and comprehensive tools becomes paramount for making informed trading decisions. In my daily trading, I rely on TradingView, an exceptional platform for stock chart analysis.

TradingView offers a plethora of features and tools that empower traders and investors to conduct in-depth chart analysis for your stock trading strategy.
To explore the benefits of TradingView, take a look my comprehensive review in the article “How TradingView Can Change the Game for Traders” You can also access the platform directly here.
🍵 Conclusion
Mastering the basics of candlestick patterns and candlestick charts is a fundamental step toward achieving success in stock market trading. The insights gained from these charts empower traders to make informed decisions, identify trends, and execute well-timed trades.
As you continue on your journey to becoming a successful trader, remember that practice is key. Take the time to analyze historical charts, identify patterns, and refine your skills. By integrating candlestick charts into your technical analysis toolkit, you’ll be better equipped to navigate the dynamic and ever-changing world of the stock market.
Mastery unfolds with patience and consistent practice. Apply your knowledge, and let these words serve as your guide on this exciting journey through the intricate world of candlestick patterns.
🌿 Frequently Asked Questions (FAQ)
Q1. What are candlestick patterns, and why are they important in stock market trading?
Candlestick patterns are visual representations of price movements in financial markets, providing insights into market sentiment. They are crucial in stock market trading as they empower traders to make informed decisions, identify trends, and execute well-timed trades.
Q2. How do I read candlestick patterns?
Reading candlestick patterns involves recognizing the signals they convey. The length of bodies, upper and lower shadows, and the color of the candle provide information about buying and selling pressures, as well as potential reversal signals.
Q3. How can I integrate candlestick charts into my trading strategy?
To integrate candlestick charts into your trading strategy, start by recognizing single and combined candlestick patterns. These patterns signal potential reversals and opportunities. Backtesting your strategy with historical data helps refine your skills and build confidence in accurate pattern interpretation.
Q4. How can I practice and improve my skills in reading candlestick patterns?
Practice is essential for improvement. Analyze historical charts, identify patterns, and expose yourself to different market situations regularly. Consider using trading simulators, such as the one provided by TradingView, offering paper money trading. This allows you to execute trades with virtual funds, providing a risk-free environment. This hands-on experience reinforces your understanding of candlestick patterns without risking real capital.
Q5. How can I leverage advanced tools to enhance my understanding of candlestick patterns and quickly identify market trends?
If you’re keen on gaining a deeper insight into how candlestick patterns can promptly reveal market trends, consider exploring TrendsSpider. This advanced service goes beyond conventional charting by providing automated technical analysis and trend-spotting tools. By incorporating TrendsSpider into your learning journey, you not only comprehend the nuances of candlestick patterns but also utilize cutting-edge technology to refine your overall trading strategy. Discover the innovative features of TrendsSpider for a comprehensive and efficient approach to mastering candlestick patterns and staying abreast of market trends.
Q6. Are candlestick patterns sufficient for learning stock market trading?
While understanding candlestick patterns is a crucial aspect of trading, it’s important to note that a well-rounded education involves multiple facets. Consider it as one essential piece of the puzzle. In addition to mastering candlestick patterns, exploring other elements like technical analysis, risk management, and market indicators is advisable for a comprehensive trading strategy.
Q7. How can I access real-time candlestick charts for live market analysis?
For real-time market analysis using candlestick charts, one highly recommended option is TradingView. It provides dynamic, real-time candlestick charts, allowing you to stay updated on live market movements. TradingView offers a user-friendly interface and a wide range of customization options, making it an excellent choice for traders seeking up-to-the-minute charting tools.
👉👉 Connect with Me: Facebook and StockTwits ✌️


